Fig. C.1
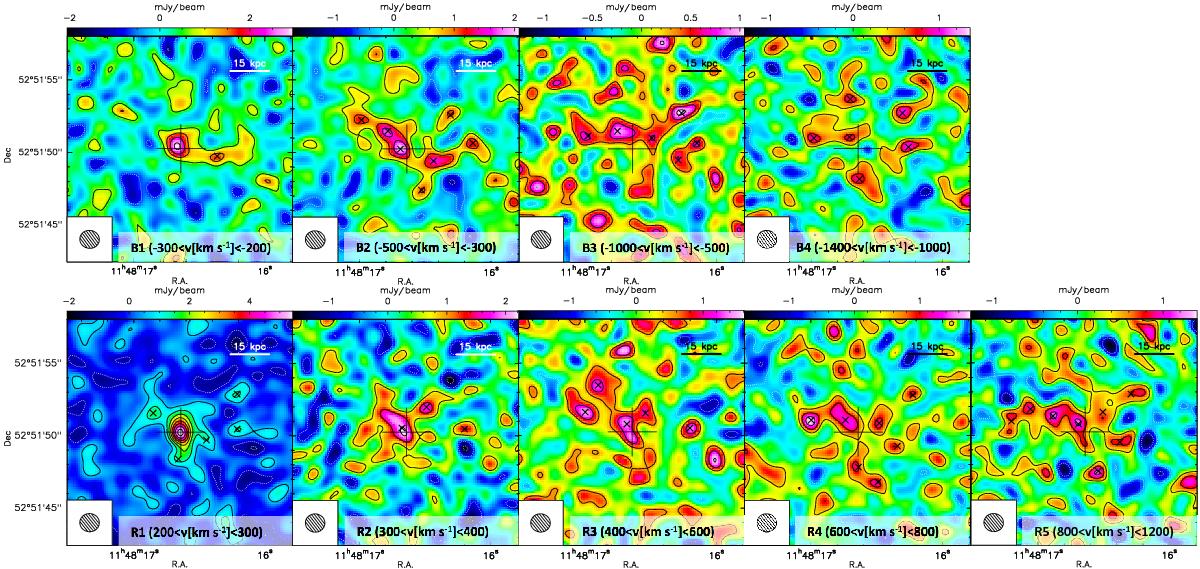
IRAM PdBI continuum-subtracted maps of the blue- (top panels) and red- (bottom panels) shifted [C ii] 158 μm emission of SDSS J1148+5251, obtained at different velocities. The corresponding velocity integration ranges are indicated on each map. Negative and positive contours are in steps of 1.5σ. In all panels the big central cross indicates the pointing and phase centre, corresponding to the optical position of the quasar. The small crosses mark the position of the 48 blobs that we identified as belonging to the outflow. For each of these clumps in outflow we estimate the dynamical time scale τdyn = R/v, where R is the distance from the quasar position, and v is the average velocity of each map.
Current usage metrics show cumulative count of Article Views (full-text article views including HTML views, PDF and ePub downloads, according to the available data) and Abstracts Views on Vision4Press platform.
Data correspond to usage on the plateform after 2015. The current usage metrics is available 48-96 hours after online publication and is updated daily on week days.
Initial download of the metrics may take a while.