Fig. A.1
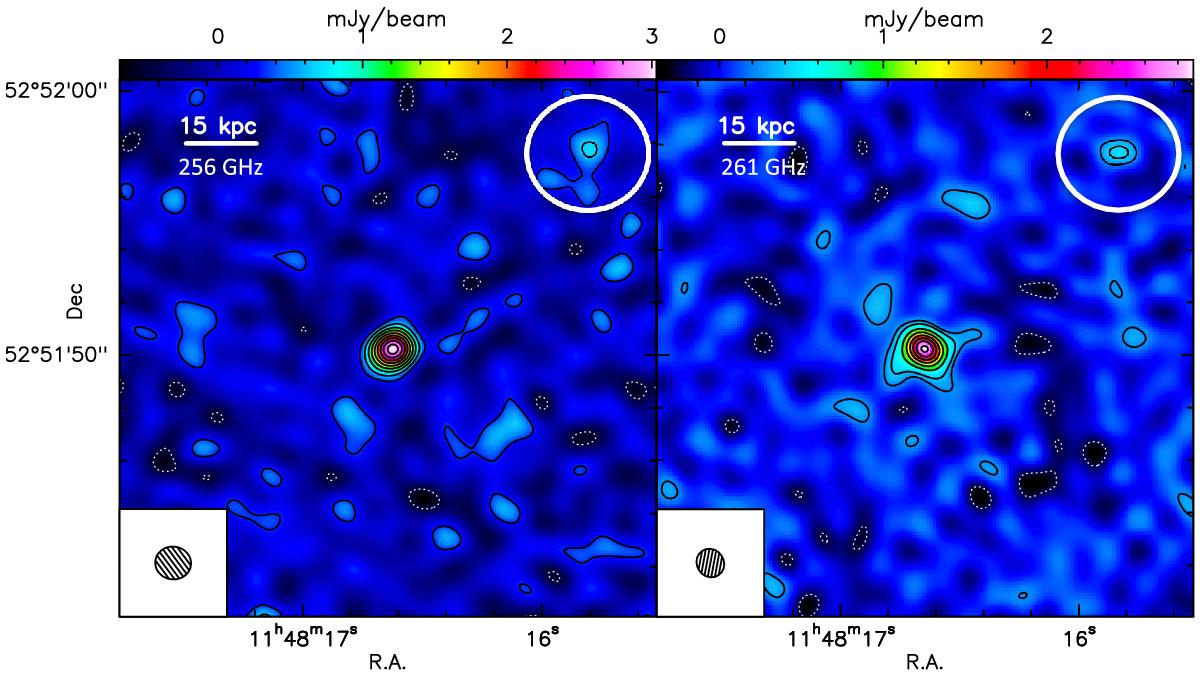
IRAM PdBI maps of the FIR continuum showing the marginal detection of an additional source in the field, north-west of SDSS J1148+5251, at a projected distance of 10.5 arcsec, originally discovered by Herschel. Left: the map on the left panel has been obtained by collapsing the line-free channels of the dataset at 256 GHz as explained in Sect. 3.1. The synthesised beam is 1.3″ × 1.2′′. Negative and positive contours correspond to − 3σ, 2σ, 4σ to 18σ in steps of 2σ (1σ rms noise is 0.159 mJy beam-1). Right: the map on the right panel has been obtained by merging the two ancillary datasets at 262 GHz and 259.4 GHz (average observed frequency of 260.7 GHz). This is the same map as Fig. 11, which is employed for studying the spatial extent of the FIR continuum. The synthesised beam is 1.1′′×1.0′′. Negative and positive contours correspond to − 3σ, 3σ, 5σ to 40σ in steps of 5σ (1σ rms noise is 0.082 mJy beam-1).
Current usage metrics show cumulative count of Article Views (full-text article views including HTML views, PDF and ePub downloads, according to the available data) and Abstracts Views on Vision4Press platform.
Data correspond to usage on the plateform after 2015. The current usage metrics is available 48-96 hours after online publication and is updated daily on week days.
Initial download of the metrics may take a while.