Fig. 14
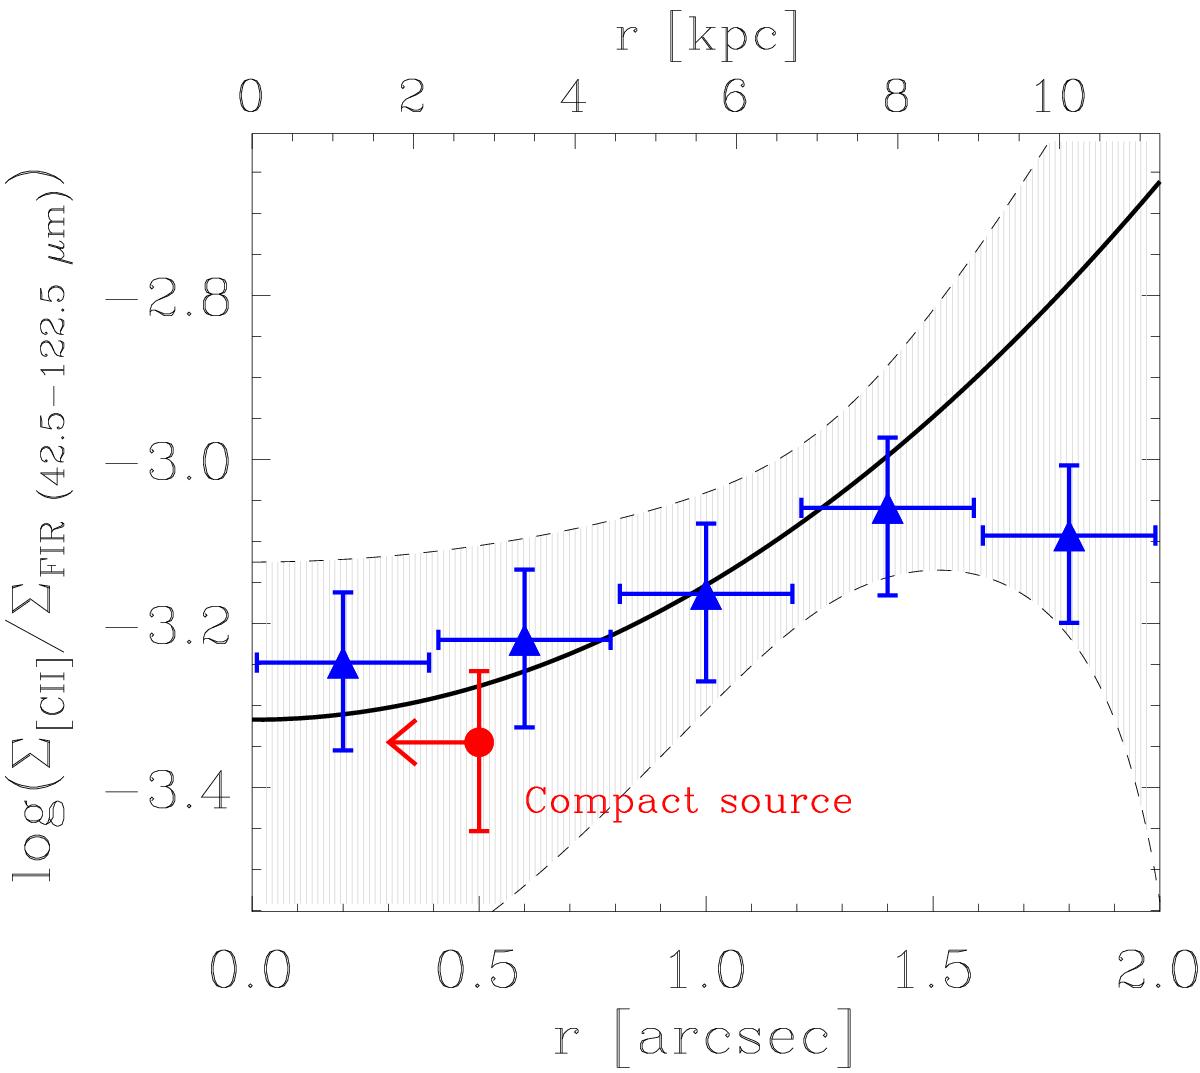
[C ii] /FIR luminosity surface density ratio as a function of the projected distance from the quasar optical position. The black curve represents our model of Σ[CII]/ ΣFIR(r) for the extended source, obtained from the analysis of the uv data as explained in Sect. 4.2. The grey shaded region indicates the statistical uncertainty on the Σ[CII]/ ΣFIR predicted by the model based on the uv analysis. The blue triangles show the values of L[CII]/LFIR calculated at different radii by integrating the extended [C ii] and FIR emission over concentric annuli. For comparison, the [C ii] /FIR luminosity ratio of the compact (unresolved) component is also shown, plotted at a representative upper limit radius of FWHMbeam/ 2, where FWHMbeam refers to the beam-size of the FIR continuum observations (Fig. 11).
Current usage metrics show cumulative count of Article Views (full-text article views including HTML views, PDF and ePub downloads, according to the available data) and Abstracts Views on Vision4Press platform.
Data correspond to usage on the plateform after 2015. The current usage metrics is available 48-96 hours after online publication and is updated daily on week days.
Initial download of the metrics may take a while.