Fig. 11
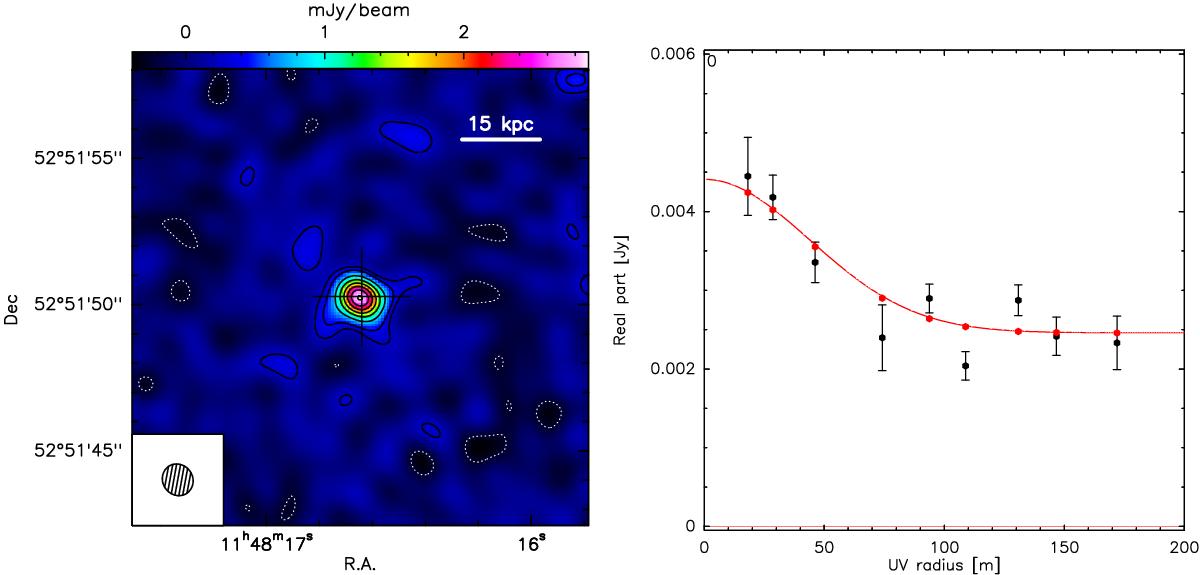
IRAM PdBI map (left) and uv plane analysis (right) of the FIR continuum of SDSS J1148+5251 at average rest-frame wavelength λ = 155 μm (average observed frequency of 261 GHz). Left: negative and positive contours correspond to − 3σ, 3σ, 5σ to 35σ in steps of 5σ (1σ rms noise is 0.082 mJy beam-1). The synthesised beam is shown at the bottom left corner (1.1′′×1.0′′) and the cross indicates the pointing and phase centre, corresponding to the optical position of the quasar. Right: real part of visibilities as a function of the uv distance (uv plot), binned in baseline steps of 20 m. The red curve indicates the best fit to the uv plot, which corresponds to the sum of two components: a point (unresolved) source, responsible for the flattening of the visibilities at large uv radii (uv radii > 100 m), and an extended (resolved) source fitted with a circular Gaussian model, which is responsible for the decreasing trend at smaller uv radii.
Current usage metrics show cumulative count of Article Views (full-text article views including HTML views, PDF and ePub downloads, according to the available data) and Abstracts Views on Vision4Press platform.
Data correspond to usage on the plateform after 2015. The current usage metrics is available 48-96 hours after online publication and is updated daily on week days.
Initial download of the metrics may take a while.