Fig. 10
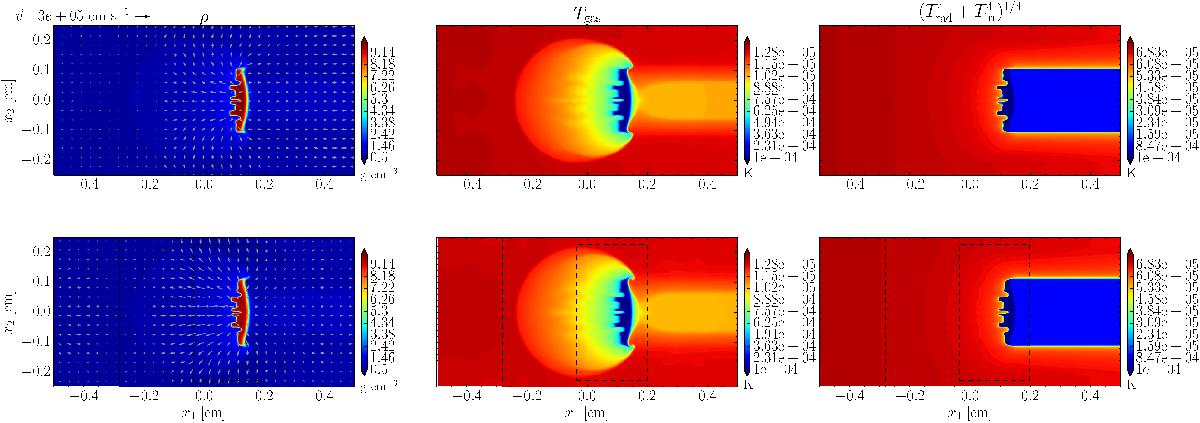
Results for the evaporating shadow test (T0 = 103530 K) at t = 1.67 × 10⁻⁶ s. The irradiation source is located at the left boundary. Top: uniform grid results. Bottom: AMR results at the same time and effective resolution as the uniform grid. Left: gas density. Middle: gas temperature. Right: total radiation temperature (diffuse + irradiation). Dashed lines denote AMR grid boundaries.
Current usage metrics show cumulative count of Article Views (full-text article views including HTML views, PDF and ePub downloads, according to the available data) and Abstracts Views on Vision4Press platform.
Data correspond to usage on the plateform after 2015. The current usage metrics is available 48-96 hours after online publication and is updated daily on week days.
Initial download of the metrics may take a while.