Fig. 4
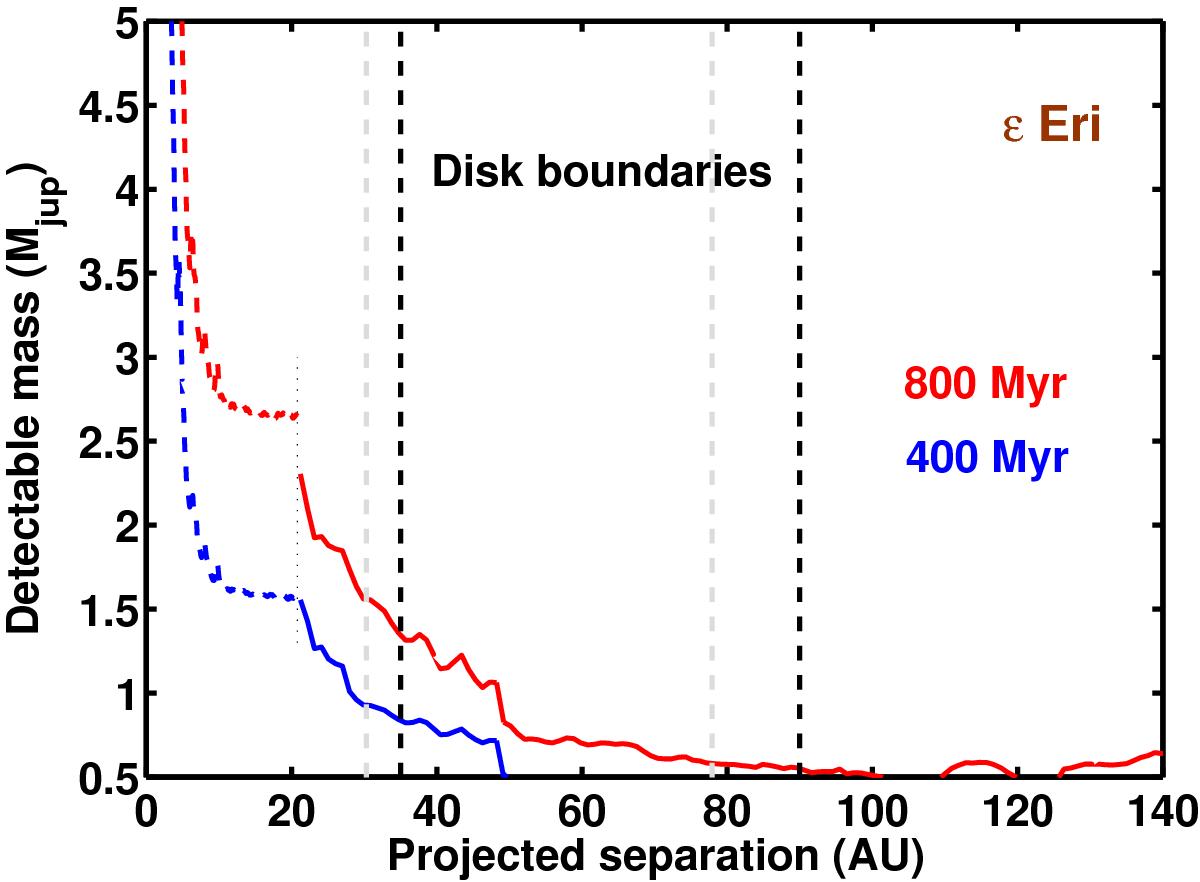
5σ sensitivity limits in terms of detectable planet mass for ϵ Eri, based on COND models. The models only extend down to 0.5 Mjup, thus the graph cuts off at that point. Aside from the Spitzer high-contrast data represented here with solid lines, the plot also shows, as dashed lines, the sensitivity from Janson et al. (2008) at smaller separations. The lower, blue points represent an age of 400 Myr, and the upper red lines an age of 800 Myr. The transition point between the different data sets is marked with a thin dashed line. Also plotted with vertical dashed lines are the inner and outer edges of the wide debris ring in the system. Gray lines are the minimum projected separations for a system inclination of ~30° (Saar & Osten 1997; Greaves et al. 1998). The full field stretches out to 400 AU with a roughly uniform sensitivity-limited performance, but has been cut off here to highlight the inner regions. When these imaging limits are combined with limits from radial velocity data (e.g., Hatzes et al. 2000; Zechmeister et al. 2013), it can be concluded that no planets more massive than 3 Mjup can exist anywhere inside of ~500 AU in the system.
Current usage metrics show cumulative count of Article Views (full-text article views including HTML views, PDF and ePub downloads, according to the available data) and Abstracts Views on Vision4Press platform.
Data correspond to usage on the plateform after 2015. The current usage metrics is available 48-96 hours after online publication and is updated daily on week days.
Initial download of the metrics may take a while.