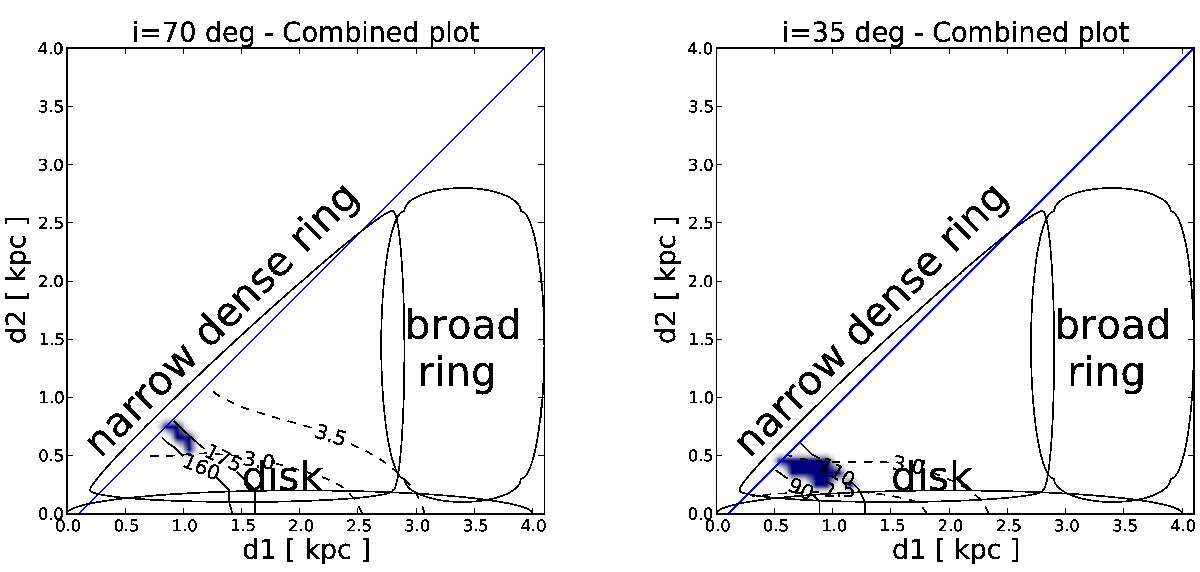
Fig. 9

Parameter space of the model grids for 3C 285 (left) and NGC 541 (right). The axes indicate the value of the outer d1 and inner d2 distances of the Toomre ring (see sketch in Fig. 8). Since d1>d2, the explored parameters lie below the blue line (bottom-right part of the plot). The black solid lines show solutions for a peak velocity of 160 and 175 km s-1 (left), and 90 and 110 km s-1 (right). The black dashed lines show the solutions for a well depth (see Fig. 10) of 30% and 35% of the peak (left), and 25% and 30% of the peak (right). These values correspond to the observational constraints extracted from the 30 m telescope spectra. The dark blue surface is the intersection that fits both solutions.
Current usage metrics show cumulative count of Article Views (full-text article views including HTML views, PDF and ePub downloads, according to the available data) and Abstracts Views on Vision4Press platform.
Data correspond to usage on the plateform after 2015. The current usage metrics is available 48-96 hours after online publication and is updated daily on week days.
Initial download of the metrics may take a while.


