Fig. 1
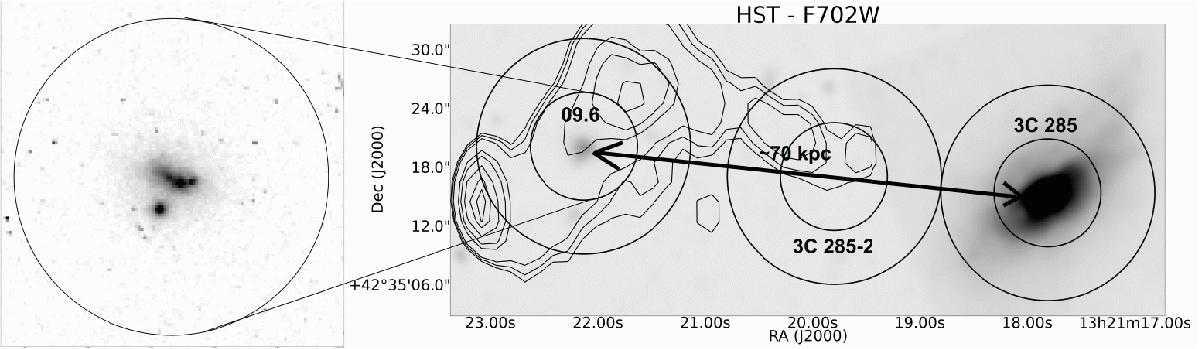
Contour map of the eastern lobe of 3C 285 observed at 21 cm (van Breugel & Dey 1993) with 5′′ resolution, as extracted from the VLA archive (NED, Leahy & Williams 1984), overlaid on a slightly smoothed Hα image from HST in the F702W filter (data from the HST archive, PI: Crane). The observed positions are shown by the CO(1−0) 24′′ and CO(2−1) 12′′ IRAM 30 m beams (circles). Details of 3C 285/09.6 are shown in the circle on the left; they show that the spot is resolved into two or maybe three sub-structures.
Current usage metrics show cumulative count of Article Views (full-text article views including HTML views, PDF and ePub downloads, according to the available data) and Abstracts Views on Vision4Press platform.
Data correspond to usage on the plateform after 2015. The current usage metrics is available 48-96 hours after online publication and is updated daily on week days.
Initial download of the metrics may take a while.