Fig. 5
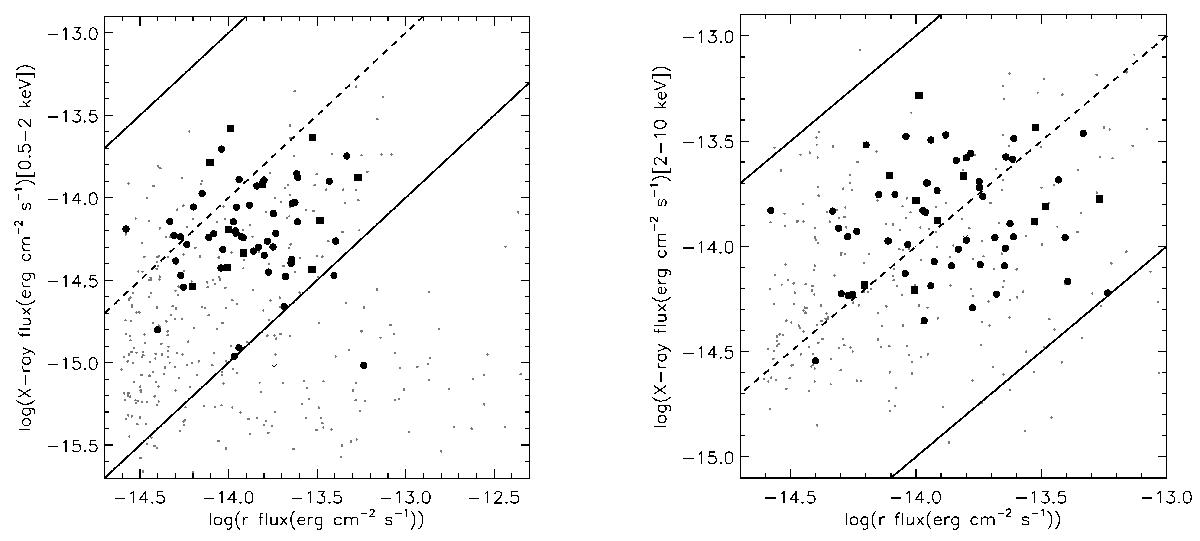
Soft (0.5–2 keV, left panel) and hard (2–10 keV, right panel) X-ray vs. optical flux for the VST variable objects with an X-ray counterpart from Chandra (dots) or XMM (squares) catalogs; Chandra fluxes were used when available, while XMM fluxes were adopted for the remaining objects. Downward arrows stand for those sources for which only upper limits of the X-ray flux were available. The smaller grey symbols in the background are shown as a reference population and stand for the X-ray objects in the Chandra catalog having a VST counterpart and r(AB) < 23 mag. The dashed line corresponds to X/O = 0, the lower and upper solid lines represent X/O = −1andX / O = 1, respectively. AGNs typically place themselves in the range where −1 ≤ X/O ≤ 1.
Current usage metrics show cumulative count of Article Views (full-text article views including HTML views, PDF and ePub downloads, according to the available data) and Abstracts Views on Vision4Press platform.
Data correspond to usage on the plateform after 2015. The current usage metrics is available 48-96 hours after online publication and is updated daily on week days.
Initial download of the metrics may take a while.