Fig. 4
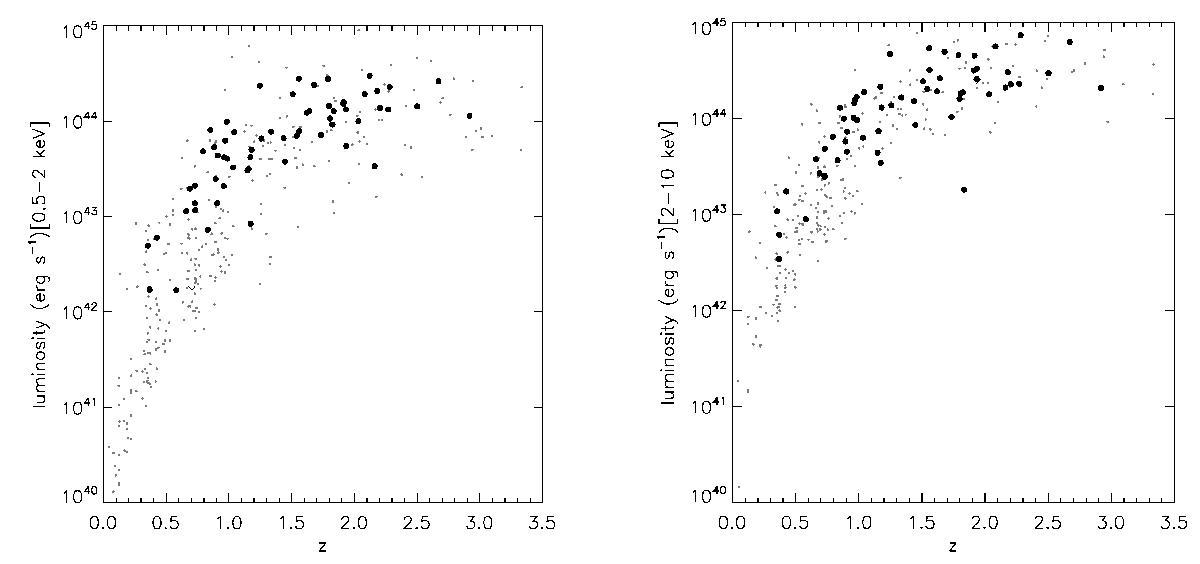
Soft (0.5–2 keV, left panel) and hard (2–10 keV, right panel) X-ray luminosity vs. redshift z for our variable sources, compared to the overall X-ray population. Larger dots represent the 63 optically variable sources with an X-ray counterpart. Chandra luminosities and redshifts were used when available, and XMM data were adopted for the remaining sources. A spectroscopic redshift value was available for all but three sources, for which photometric redshifts were used (Salvato et al. 2011). The downward arrows stand for those sources for which only upper limits of the flux values were available. Smaller grey dots are from the Chandra catalog and represent a reference population.
Current usage metrics show cumulative count of Article Views (full-text article views including HTML views, PDF and ePub downloads, according to the available data) and Abstracts Views on Vision4Press platform.
Data correspond to usage on the plateform after 2015. The current usage metrics is available 48-96 hours after online publication and is updated daily on week days.
Initial download of the metrics may take a while.