Fig. 3
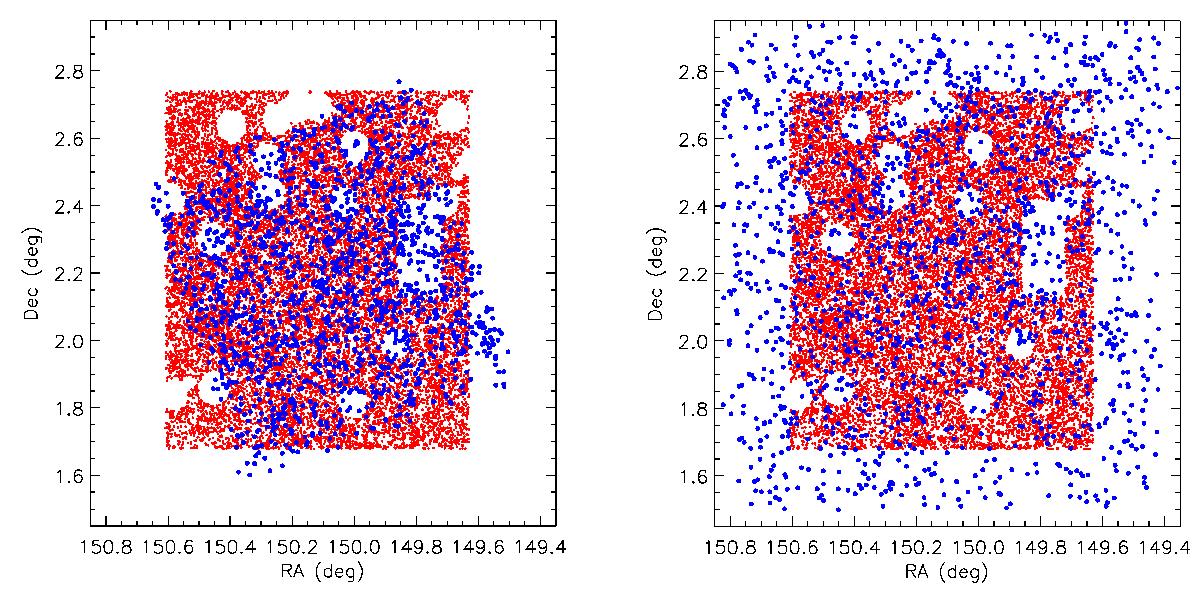
Comparison between the VST COSMOS catalog (smaller red dots) and the Chandra (left panel) and XMM (right panel) COSMOS catalogs (larger blue dots). The holes in the VST catalog represent regions that were masked and hence not taken into account in our variability analysis because of the presence of bright star halos (see Sect. 3). It is apparent that part of the COSMOS field as imaged by the VST is not covered by Chandra observations. In both panels we showed all the sources in each of the X-ray catalogs, but we limited our analysis to those falling in the VST FoV, out of the masked areas.
Current usage metrics show cumulative count of Article Views (full-text article views including HTML views, PDF and ePub downloads, according to the available data) and Abstracts Views on Vision4Press platform.
Data correspond to usage on the plateform after 2015. The current usage metrics is available 48-96 hours after online publication and is updated daily on week days.
Initial download of the metrics may take a while.