Fig. 1
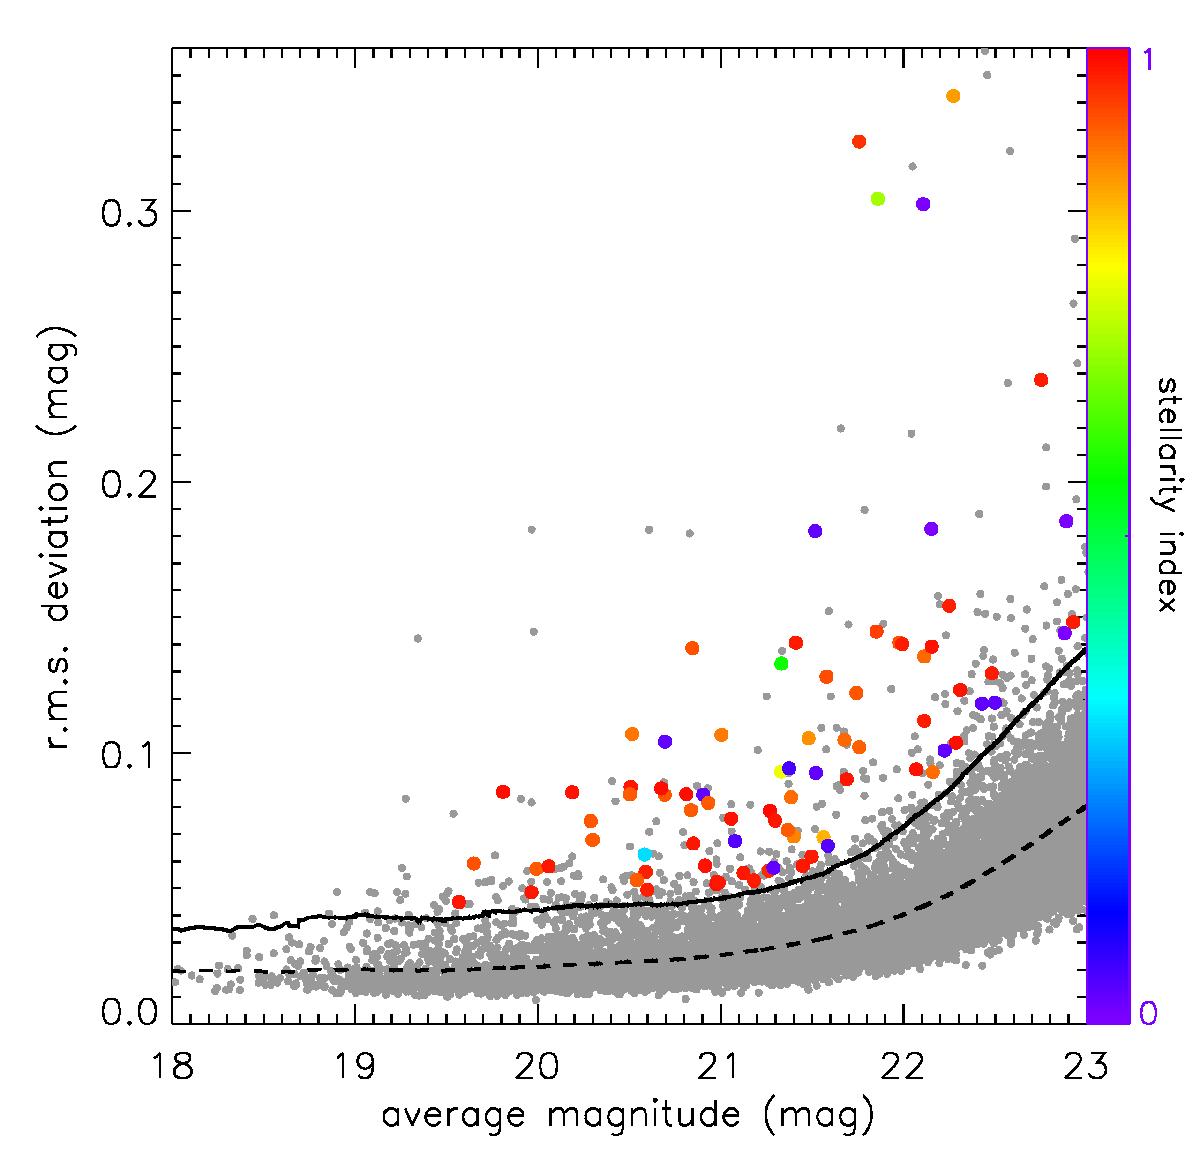
Light curve rms as a function of magnitude. The running average of the rms (dashed line) and the variability threshold (solid line) are also shown. Objects above the threshold are assumed to be variable. Large dots represent the sources belonging to our secure sample (end of Sect. 3). They are color-coded according to the HST stellarity index as in Fig. 6; three sources do not have a HST counterpart (see Sect. 5), hence we referred to the VST COSMOS stellarity index in those cases.
Current usage metrics show cumulative count of Article Views (full-text article views including HTML views, PDF and ePub downloads, according to the available data) and Abstracts Views on Vision4Press platform.
Data correspond to usage on the plateform after 2015. The current usage metrics is available 48-96 hours after online publication and is updated daily on week days.
Initial download of the metrics may take a while.