Fig. 3
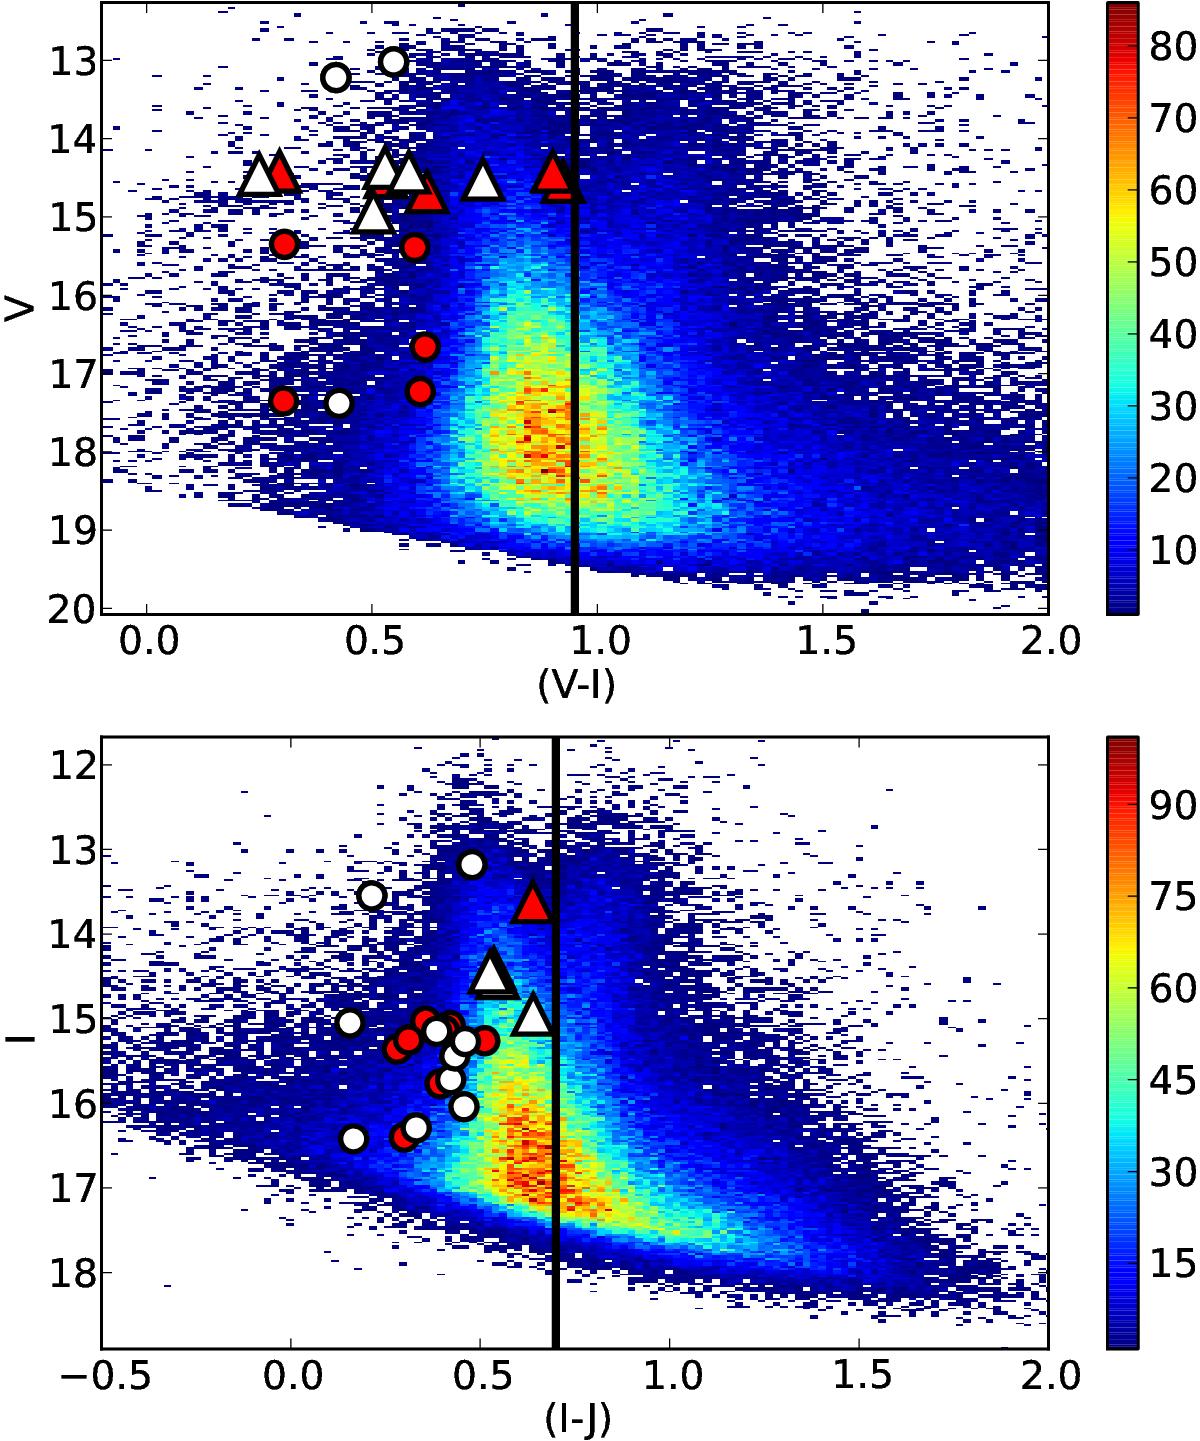
Hess diagrams for two different regions of the survey. The top panel shows a region that was observed in both V and I bands in our survey. The region shown in the bottom panel was observed only in I and we used the 2MASS J band to construct a color–magnitude diagram. Black vertical lines indicate the color cut for selecting RR Lyrae star candidates (however, the most interesting region was explored with out a color cut). The triangle symbols indicate the confirmed RR Lyrae stars with a brightness similar to the horizontal branch of ω Centauri (see Sect. 4.2). Circles correspond to other RR Lyrae stars in the field of view (stars in the foreground or background of the cluster). RR Lyrae stars of types ab and c are presented as red and white symbols. The color scale is proportional to the number of stars in each bin.
Current usage metrics show cumulative count of Article Views (full-text article views including HTML views, PDF and ePub downloads, according to the available data) and Abstracts Views on Vision4Press platform.
Data correspond to usage on the plateform after 2015. The current usage metrics is available 48-96 hours after online publication and is updated daily on week days.
Initial download of the metrics may take a while.