Fig. 1
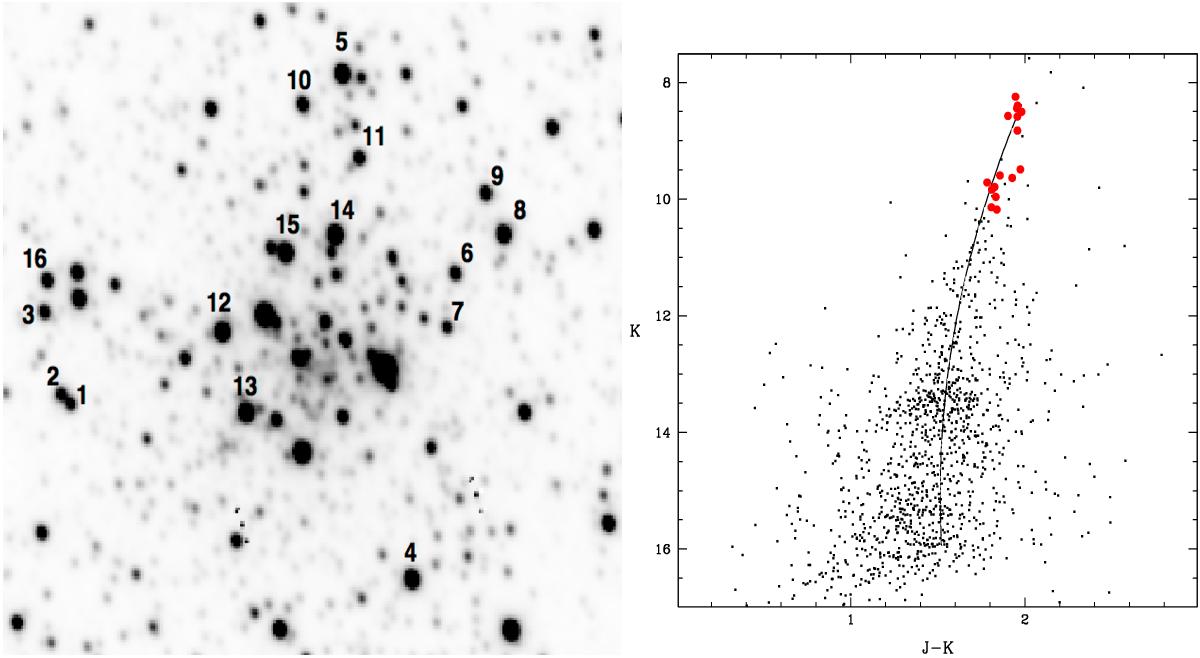
Left panel: sofI K-band image of the core region of Ter 1. The field of view shown in the map is ~1′ × 1′, north is up and east on the left. The observed stars are numbered (cf. Table 1). Right panel: observed K, (J − K) CMD, and mean RGB ridgeline of Ter 1 in the central ~1 arcmin in radius from Valenti et al. (2010). Large red filled points denote the stars observed spectroscopically.
Current usage metrics show cumulative count of Article Views (full-text article views including HTML views, PDF and ePub downloads, according to the available data) and Abstracts Views on Vision4Press platform.
Data correspond to usage on the plateform after 2015. The current usage metrics is available 48-96 hours after online publication and is updated daily on week days.
Initial download of the metrics may take a while.