Fig. 7
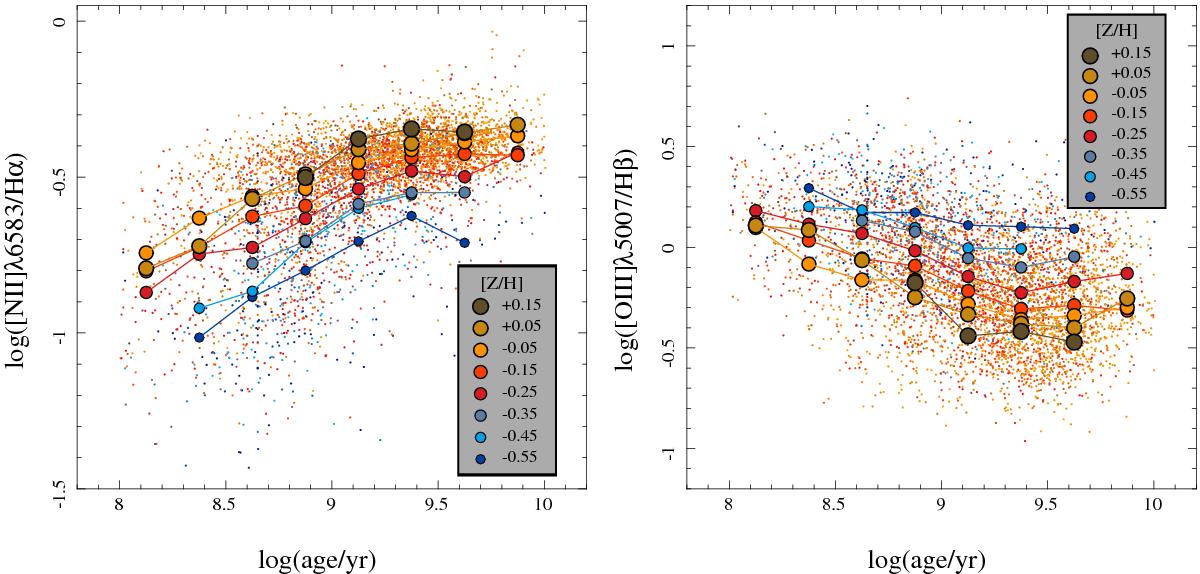
Left panel: distribution of the [N ii] λ6583/Hα line ratio along the luminosity-weighted ages of the underlying stellar population for the ~5000 H ii regions included in our sample (individual dots), with a color code representing the luminosity weighted metallicity of the underlying stellar population. The solid circles and individual lines illustrate how the considered ratio change along the stellar population age for a certain metallicity range. Each circle represents the average line ratio within a bin of 0.25 dex in log(age/yr) for a fixed range of metallicities (within a range of 0.1 dex). Consecutive circles for a particular metallicity are linked with a solid line, and both of them are represented by a fixed color, different for each metallicity. The actual value of the metallicity corresponding to each color is indicated in the enhanced box. Right panel: similar distribution for the [O iii] λ5007/Hβ line. Symbols, solid lines, and color codes are the same as presented in the previous panel.
Current usage metrics show cumulative count of Article Views (full-text article views including HTML views, PDF and ePub downloads, according to the available data) and Abstracts Views on Vision4Press platform.
Data correspond to usage on the plateform after 2015. The current usage metrics is available 48-96 hours after online publication and is updated daily on week days.
Initial download of the metrics may take a while.