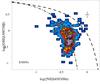
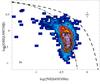
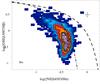
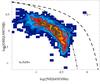
Fig. 4
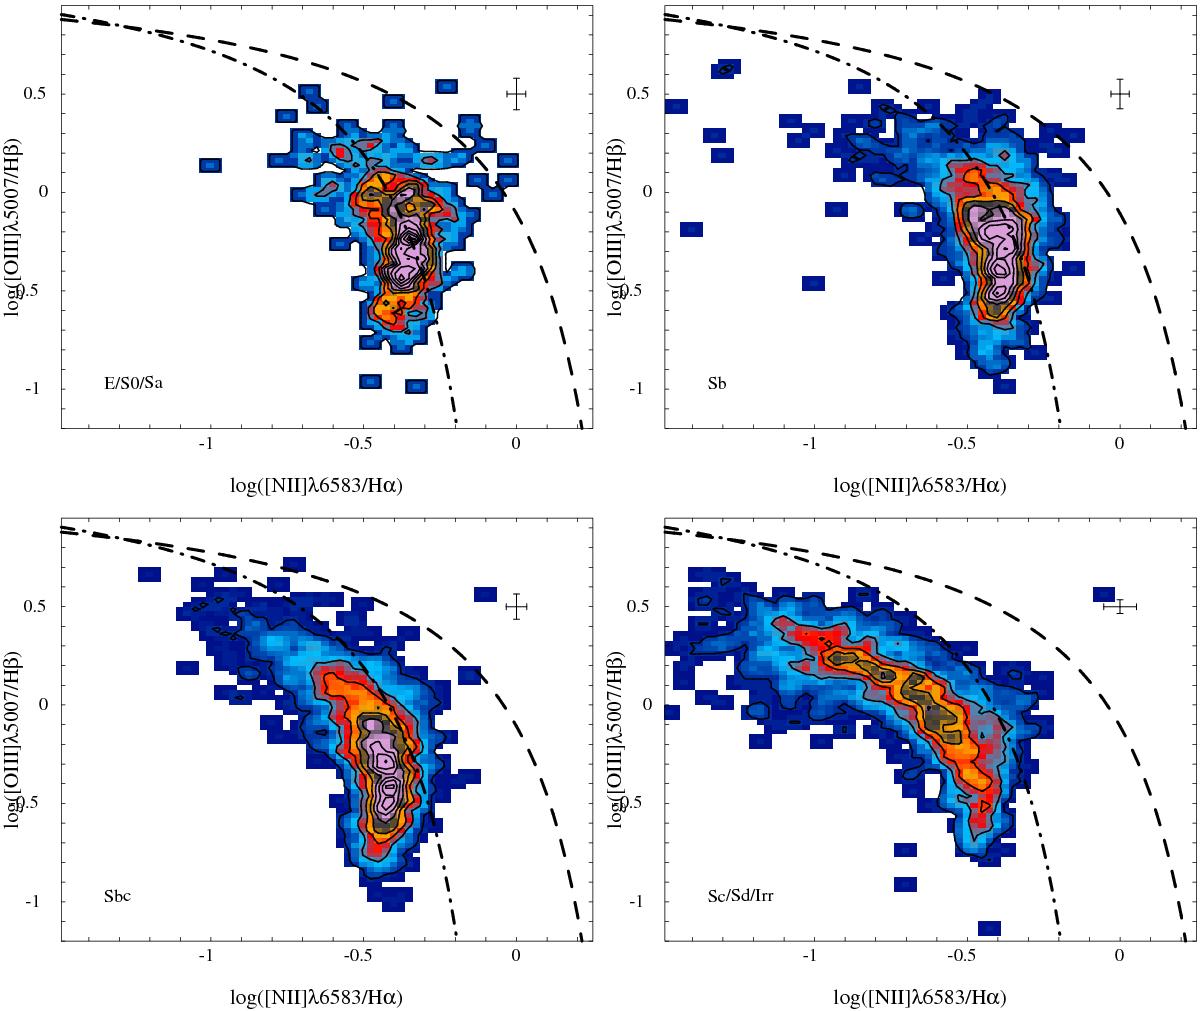
[O iii] λ5007/Hβ vs. [N ii] λ6583/Hα diagnostic diagram for the ~5000 H ii regions described in the text. The contours show the density distribution of these regions with the diagram plane, with the outermost contour enclosing 95% of the regions and each consecutive one enclosing 20% fewer regions. In each panel, H ii regions corresponding to different galaxies with different morphological types are represented: (i) E/S0/Sa top left; (ii) Sb top right; (iii) Sbc bottom left; and (iv) Sc/Sd/Irr bottom right panel. In all panels, the dot-dashed and dashed lines represent the demarcation curves described in Fig. 1.
Current usage metrics show cumulative count of Article Views (full-text article views including HTML views, PDF and ePub downloads, according to the available data) and Abstracts Views on Vision4Press platform.
Data correspond to usage on the plateform after 2015. The current usage metrics is available 48-96 hours after online publication and is updated daily on week days.
Initial download of the metrics may take a while.