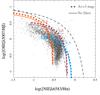
Fig. 1
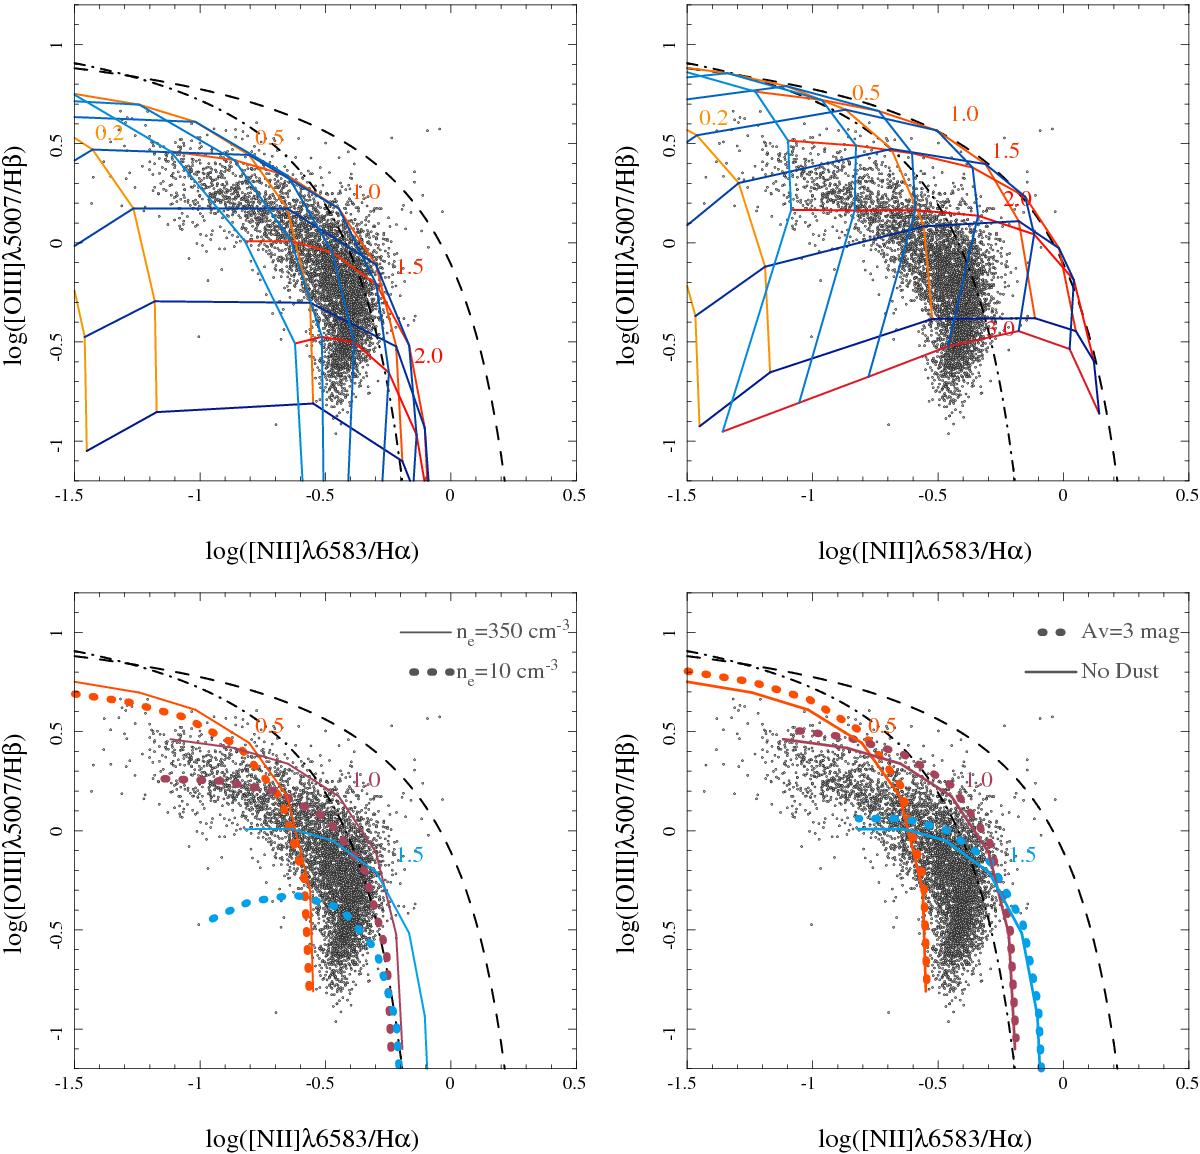
Top left panel: distribution of the [O iii] λ5007/Hβ vs. [N ii] λ6583/Hα line ratios for the ~5000 H ii ionized regions included in our sample. The colored solid lines represent the expected line ratios derived from the MAPPINGS-III ionization models, based on an instantaneous zero-age starbust model based on the PEGASE spectral energy distribution (Kewley et al. 2001; Dopita et al. 2000), and a fixed electron density of 350 cm-3. Each orange-to-red solid line corresponds to a different metallicity, which is indicated with the corresponding label and color (ranging from 0.2 to 2.0 solar metallicities), and each blue-to-cyan solid-line corresponds to a different ionization parameter of the radiation field (ranging from log (u) = −3.7, for the dark blue, to log (u) = −2, at the cyan blue). Top right panel: similar plot, with the only difference being that now the colored solid lines represent the expected line ratios for a continuous starburst model 4 Myr since its ignition. Bottom left panel: similar plot, with the only difference being in this case that the colored solid lines and the dotted lines correspond to the expected line ratios for a photoionization model based on an instantaneous zero-age starburst, with a constant metallicity (indicated with a label and represented with a fixed color), but for two different electron densities (10 cm-3, for the dotted line, and 350 cm-3, solid one). Bottom-right panel: similar plot, with the only difference being that in this case the colored solid lines and the dotted lines correspond to the expected line ratios for a photoionization model based on an instantaneous zero-age starburst, with constant metallicity and a fixed electron density shown in top left panel, but for two different dust attenuations (no dust, for the solid-line, and AV = 3 mag for the dotted one). In all the panels, the dot-dashed and dashed line represent the Kauffmann et al. (2003) and Kewley et al. (2001) demarcation curves, respectively. They are usually invoked to distinguish between classical star-forming objects (below the dashed dotted line), and AGN powered sources (above the dashed line). Regions between both lines are considered intermediate ones.
Current usage metrics show cumulative count of Article Views (full-text article views including HTML views, PDF and ePub downloads, according to the available data) and Abstracts Views on Vision4Press platform.
Data correspond to usage on the plateform after 2015. The current usage metrics is available 48-96 hours after online publication and is updated daily on week days.
Initial download of the metrics may take a while.