Fig. 4
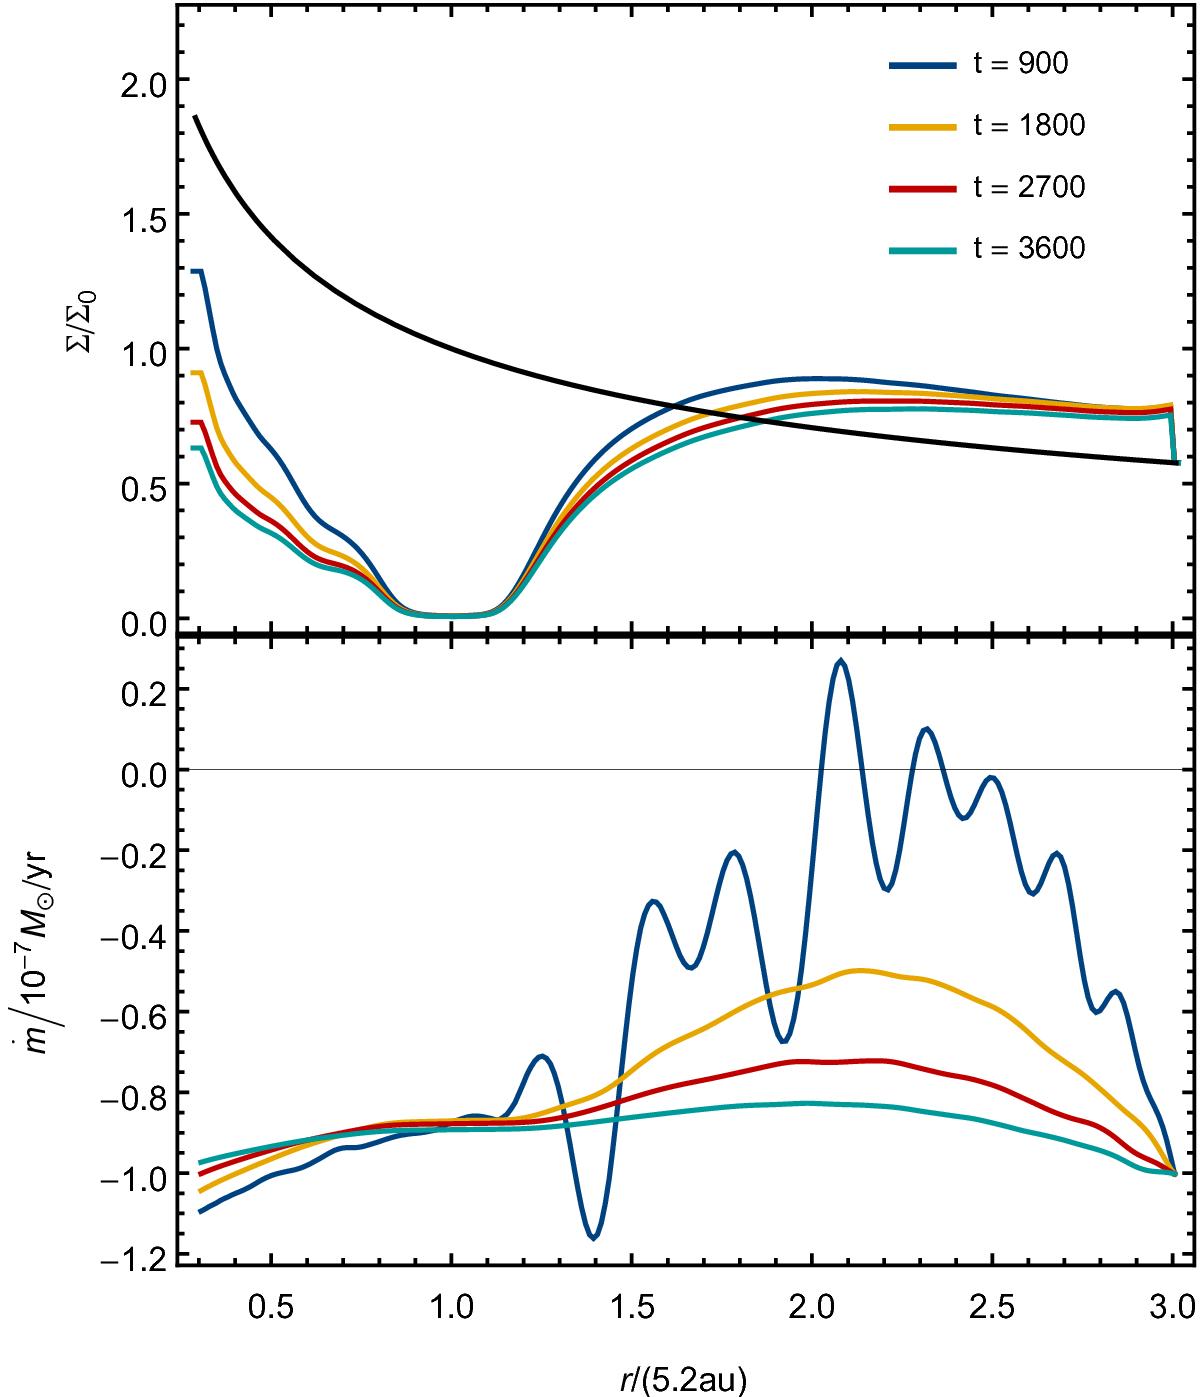
Azimuthally averaged surface density profile (top) and the migration rate profile (bottom) in case of (α,q,ṁ) = (0.003,0.001,10-7) as in Fig. 1. The planet is at r = 1.0. The profiles are taken at different times after the beginning of the calculation. The black line indicates the initial density profile at the beginning of the simulation before the planet was added.
Current usage metrics show cumulative count of Article Views (full-text article views including HTML views, PDF and ePub downloads, according to the available data) and Abstracts Views on Vision4Press platform.
Data correspond to usage on the plateform after 2015. The current usage metrics is available 48-96 hours after online publication and is updated daily on week days.
Initial download of the metrics may take a while.