Fig. 16
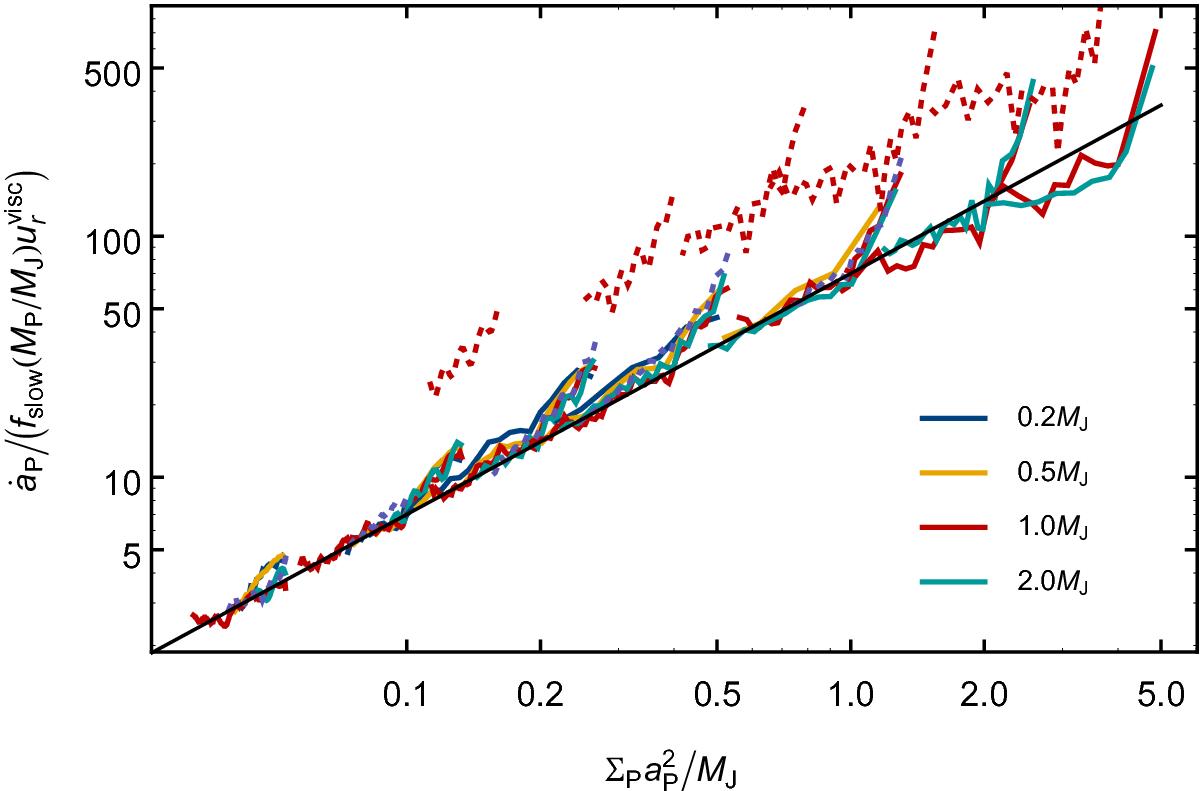
Normalized migration rates of planets with different masses between 0.2 and 2 MJ. The migration rate is scaled with the slow down factor and planet mass (see Eq. (13)). The slope of the black line is 1. The dotted line corresponds to α = 0.001. Accreting planets are indistinguishable from the non-accreting planets and therefore not shown here. Otherwise the plot is similar to Fig. 13.
Current usage metrics show cumulative count of Article Views (full-text article views including HTML views, PDF and ePub downloads, according to the available data) and Abstracts Views on Vision4Press platform.
Data correspond to usage on the plateform after 2015. The current usage metrics is available 48-96 hours after online publication and is updated daily on week days.
Initial download of the metrics may take a while.