Fig. 15
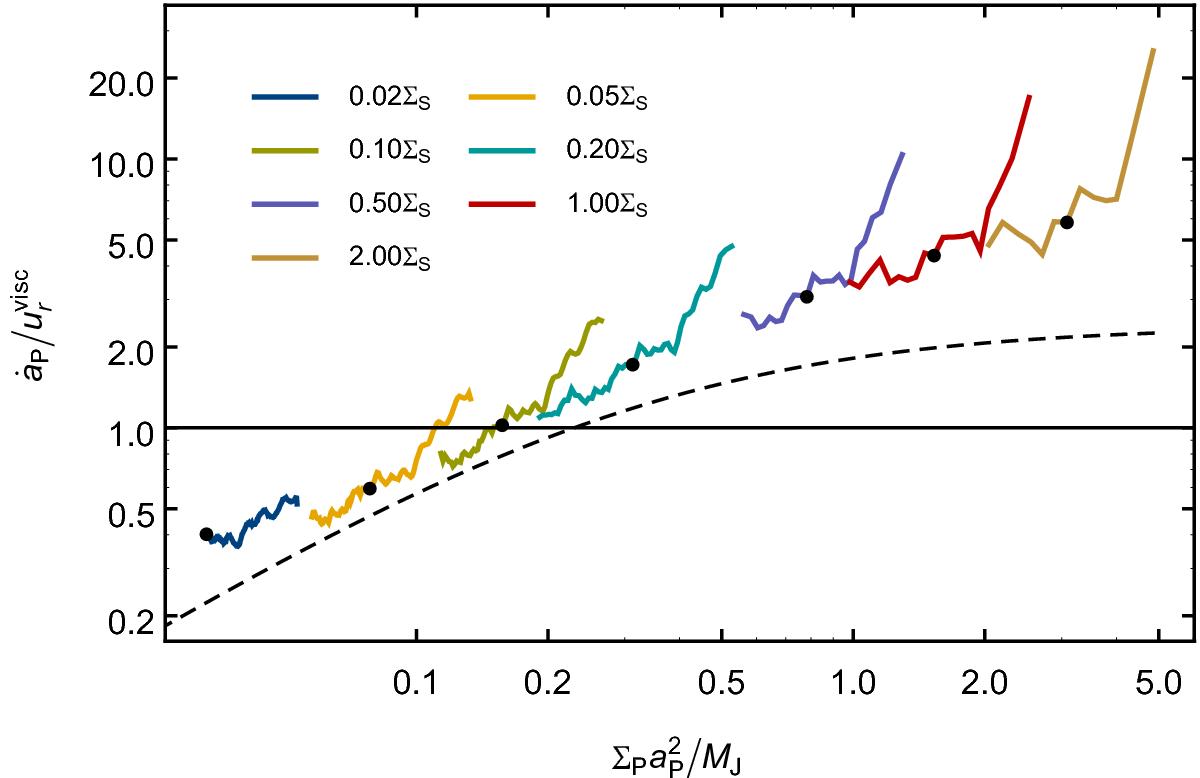
Migration rate of a Jupiter mass planet normalized by the viscous accretion velocity. Apart from the different y-axis the plot is similar to Fig. 13. The horizontal line corresponds to ![]() . The dashed line shows a fit of Duffell et al. (2014), but they used constant viscosity equal to α = 0.01 at r = 5.2 au, so their fit is normalized with
. The dashed line shows a fit of Duffell et al. (2014), but they used constant viscosity equal to α = 0.01 at r = 5.2 au, so their fit is normalized with ![]() for that α.
for that α.
Current usage metrics show cumulative count of Article Views (full-text article views including HTML views, PDF and ePub downloads, according to the available data) and Abstracts Views on Vision4Press platform.
Data correspond to usage on the plateform after 2015. The current usage metrics is available 48-96 hours after online publication and is updated daily on week days.
Initial download of the metrics may take a while.