Fig. 11
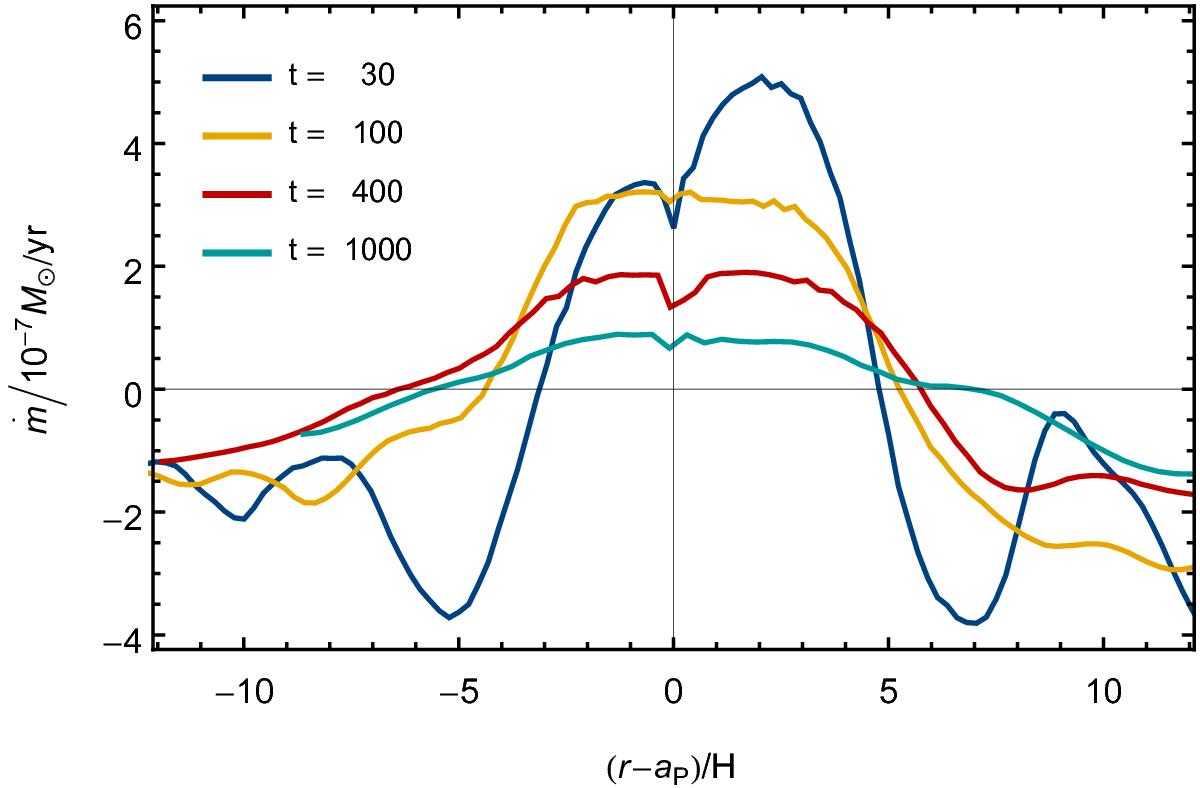
Azimuthally averaged local accretion rate, ṁ(r), at different times during the inward migration of the planet for the standard model (q = 0.001, ṁ = 10-7, α = 0.003). The plot is similar to Fig. 4, which has the same parameters, but now for moving planets. To compare the accretion rate near the planet the position is rescaled to units of the disk scale height at the position of the planet. The labels refer to the elapsed time (in initial orbits) after the release of the planet.
Current usage metrics show cumulative count of Article Views (full-text article views including HTML views, PDF and ePub downloads, according to the available data) and Abstracts Views on Vision4Press platform.
Data correspond to usage on the plateform after 2015. The current usage metrics is available 48-96 hours after online publication and is updated daily on week days.
Initial download of the metrics may take a while.