Fig. 5
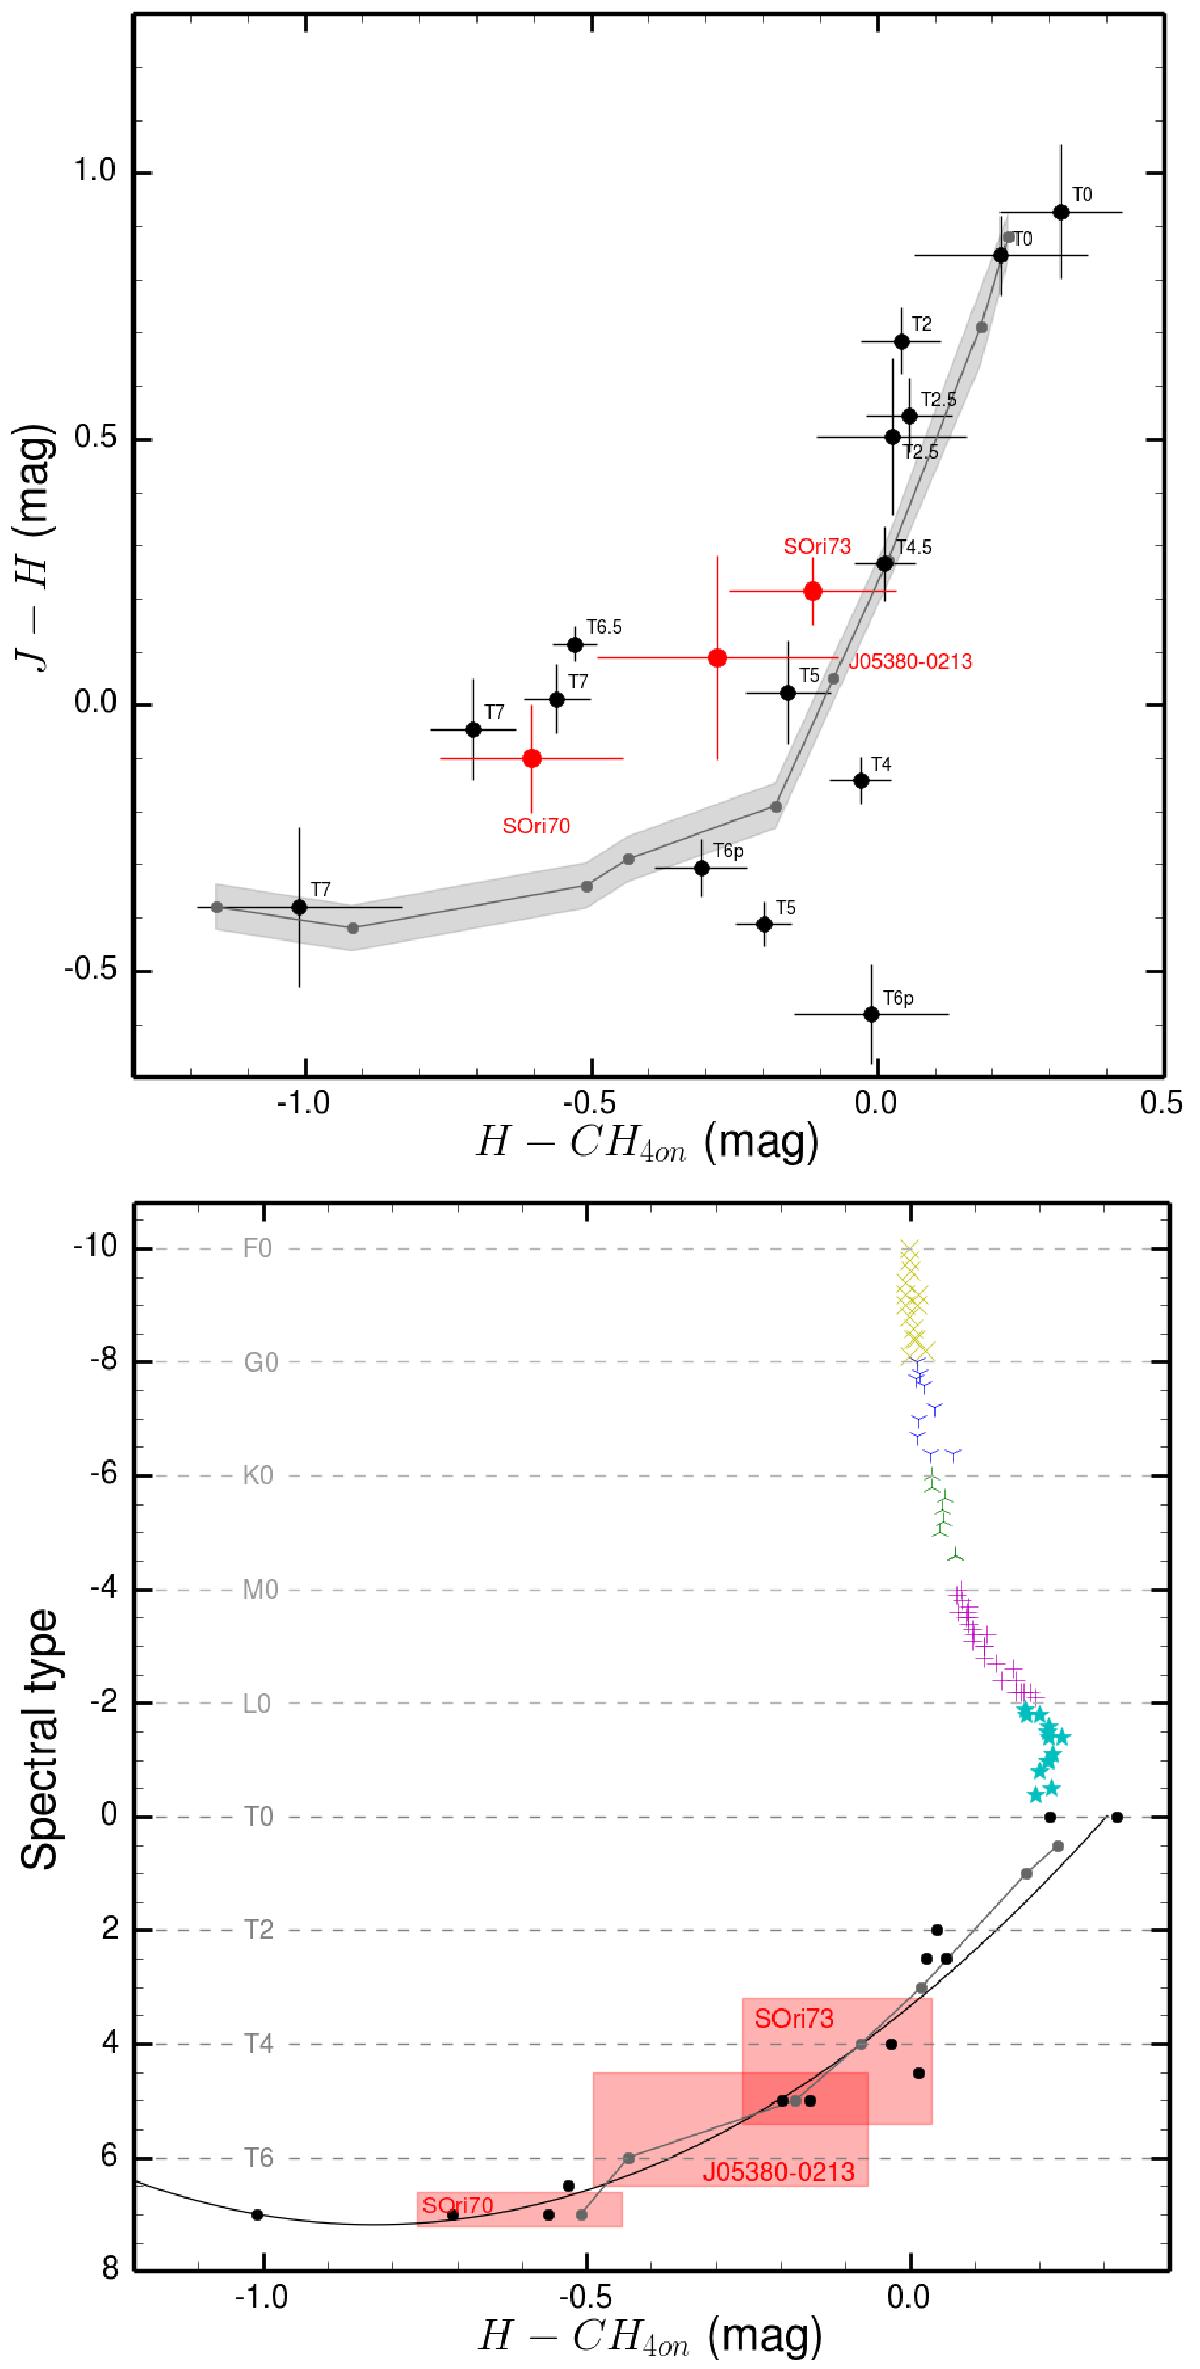
H − CH4on color as a function of J − H of T-type dwarfs in the top panel, and as a function of F0 through T7 spectral types in the bottom panel. S Ori 70, 73, and J0538−0213 are labeled and indicated in red. The black solid circles stand for the 15 field T dwarfs with LIRIS photometric data (the T6p dwarf is not included in the bottom panel). In the top panel, the solid line with a gray shaded area (accounting for J − H errors only) corresponds to the spectrophotometric methane colors computed from the integration of literature observed spectra (from right to left, the small dots in this line represent T0.5, T1, T3, T4, T5, T6, T7, T8, and T9). We note the agreement between this curve and the directly measured LIRIS colors. This line is also included in the bottom panel in gray and overlaps with the solid black curve that represents the second-order polynomial fit of the LIRIS methane observations. The y-axis is not equally scaled for all spectral types. For the T-type regime, the scale is enlarged for the clarity of the figure. The reddish boxes of the S Ori objects stand for the LIRIS H − CH4on error bars and the uncertainties associated with the determination of their spectral types from the methane data.
Current usage metrics show cumulative count of Article Views (full-text article views including HTML views, PDF and ePub downloads, according to the available data) and Abstracts Views on Vision4Press platform.
Data correspond to usage on the plateform after 2015. The current usage metrics is available 48-96 hours after online publication and is updated daily on week days.
Initial download of the metrics may take a while.