Fig. 4
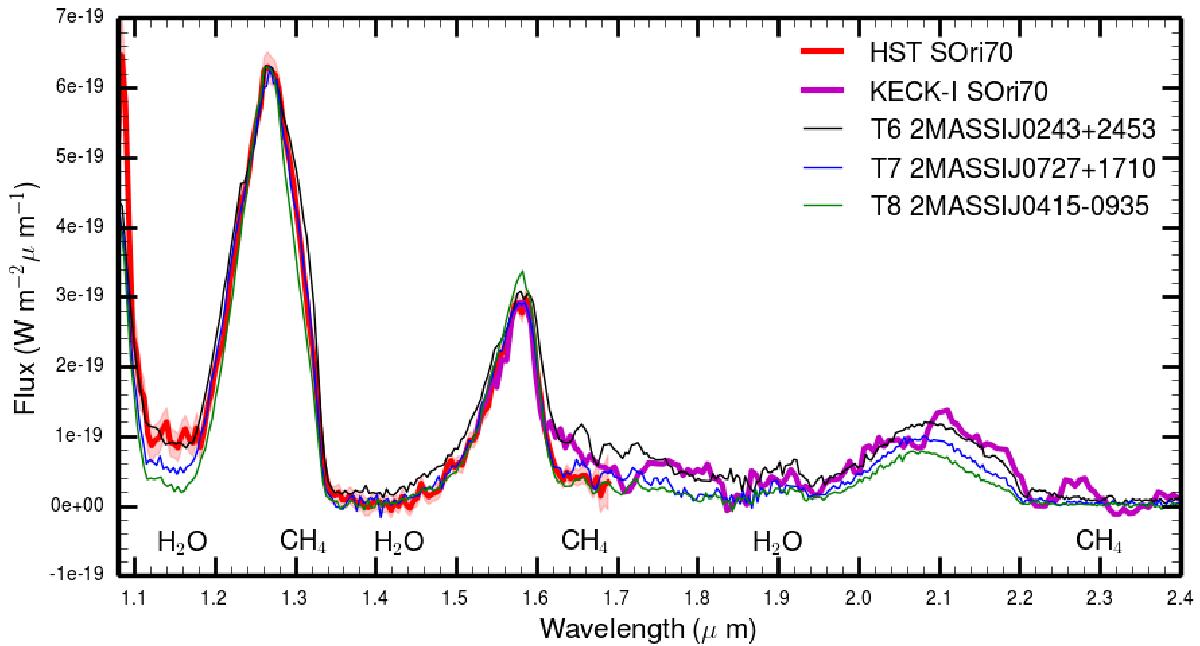
Merged HST/WFC3 (JH, red) and Keck/NIRC (HK, magenta) spectrum of S Ori 70. The two original datasets were fused at the H band (1.575–1.581 μm). Comparison spectra (thin color lines) correspond to 2MASS IJ0243137+245329 (T6, Burgasser et al. 2004b), 2MASS IJ0727182+171001 (T7, Burgasser et al. 2006), and 2MASS IJ0415195−093506 (T8, Burgasser et al. 2004b). The most prominent features are indicated. Comparison spectra are normalized to the flux of S Ori 70 at 1.263–1.269 μm.
Current usage metrics show cumulative count of Article Views (full-text article views including HTML views, PDF and ePub downloads, according to the available data) and Abstracts Views on Vision4Press platform.
Data correspond to usage on the plateform after 2015. The current usage metrics is available 48-96 hours after online publication and is updated daily on week days.
Initial download of the metrics may take a while.