Fig. 3
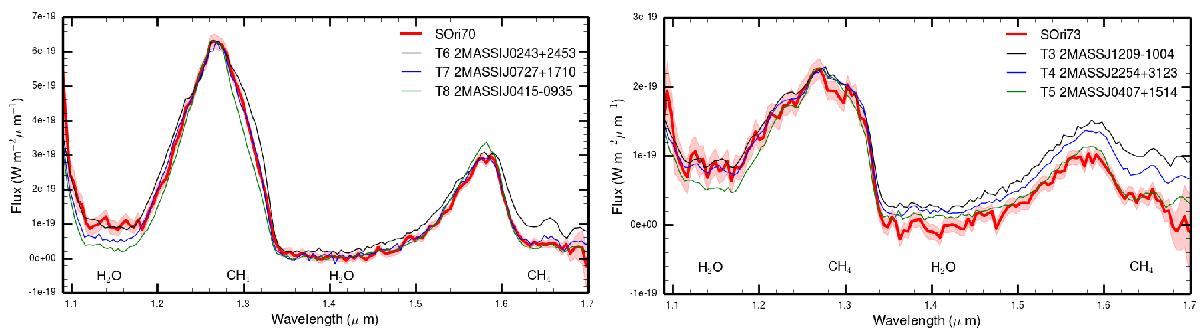
S Ori 70 and S Ori 73 HST/WFC3 spectra (solid red line) plotted along with flux uncertainties (reddish shaded area) as given by the reduction software. Low-resolution spectra of field T dwarfs are shown with thin solid lines. In the left panel, comparison spectra correspond to 2MASS IJ0243137+245329 (T6, Burgasser et al. 2004b), 2MASS IJ0727182+171001 (T7, Burgasser et al. 2006), and 2MASS IJ0415195−093506 (T8, Burgasser et al. 2004b). In the right panel, there are 2MASSJ 12095613−1004008 (T3, Burgasser et al. 2004b), 2MASS J2254188+312349 (T4, Burgasser et al. 2004b), and 2MASS J04070885+1514565 (T5, Burgasser et al. 2004b). The most prominent molecular features are indicated. All spectra are normalized to the fluxes of S Ori 70 and S Ori 73 at 1.262–1.274 μm.
Current usage metrics show cumulative count of Article Views (full-text article views including HTML views, PDF and ePub downloads, according to the available data) and Abstracts Views on Vision4Press platform.
Data correspond to usage on the plateform after 2015. The current usage metrics is available 48-96 hours after online publication and is updated daily on week days.
Initial download of the metrics may take a while.