Free Access
Fig. 7
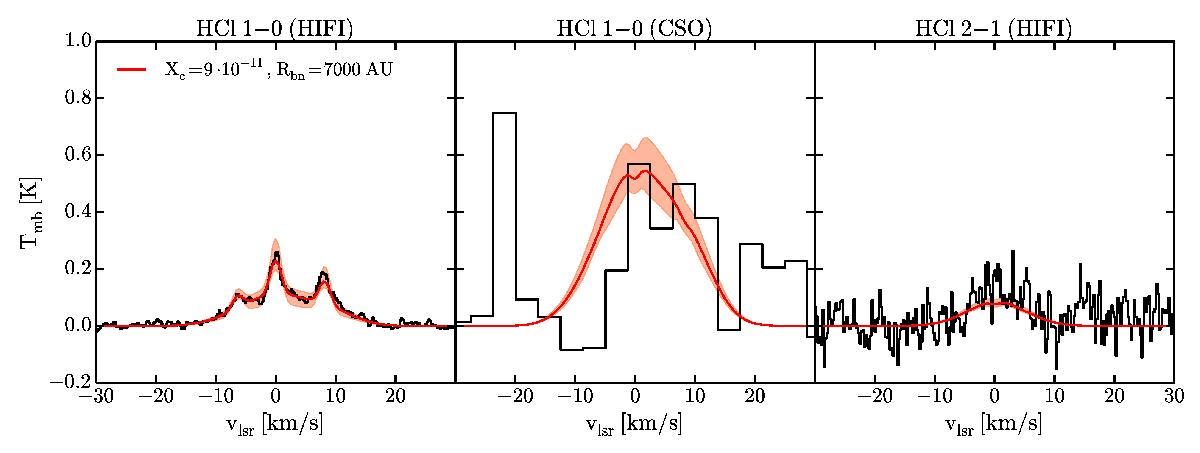
HCl 1–0 and 2–1 transitions as observed with HIFI and CSO (black). Overplotted are the best-fit constant HCl abundance model (red), and the reduced χ2< 3 range (shaded orange) of the models. The strongest feature in the CSO data, at −20 km s-1, is a CH3OH line.
Current usage metrics show cumulative count of Article Views (full-text article views including HTML views, PDF and ePub downloads, according to the available data) and Abstracts Views on Vision4Press platform.
Data correspond to usage on the plateform after 2015. The current usage metrics is available 48-96 hours after online publication and is updated daily on week days.
Initial download of the metrics may take a while.