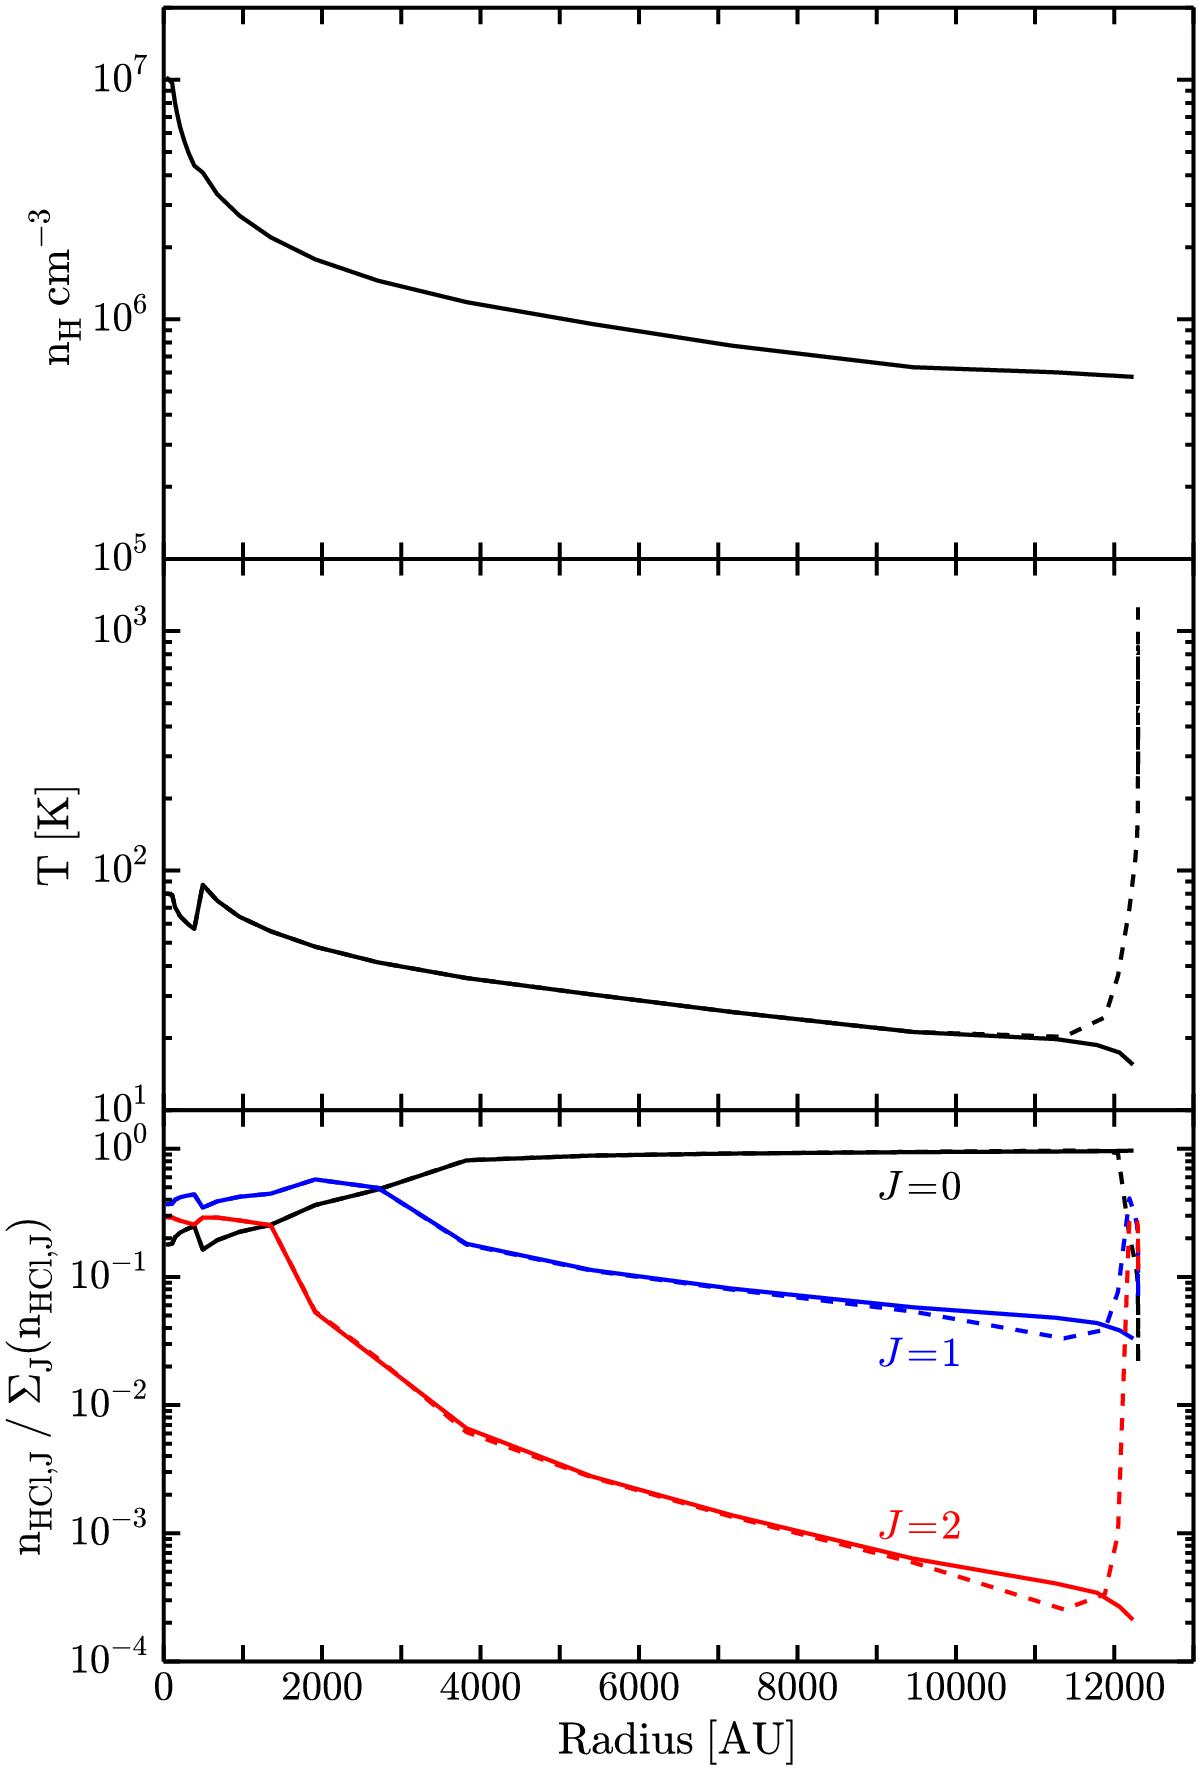
Fig. 5

Top and middle panels: large-scale source structure of FIR 4 (ngas at top, Tgas at middle) from Crimier et al. (2009, C09), corresponding to an integrated luminosity of 1000 L⊙. Bottom panel: relative populations of the lowest HCl rotational states, showing J = 0 (black), J = 1 (blue), and J = 2 (red) for the C09 source structure without modification (solid lines) and with an added external irradiation of G0 = 415 ISRF (dashed lines; Sect. 5.4). The level populations were modelled with Ratran using the new hyperfine collision rate coefficients presented in Appendix A.
Current usage metrics show cumulative count of Article Views (full-text article views including HTML views, PDF and ePub downloads, according to the available data) and Abstracts Views on Vision4Press platform.
Data correspond to usage on the plateform after 2015. The current usage metrics is available 48-96 hours after online publication and is updated daily on week days.
Initial download of the metrics may take a while.


