Free Access
Fig. 2
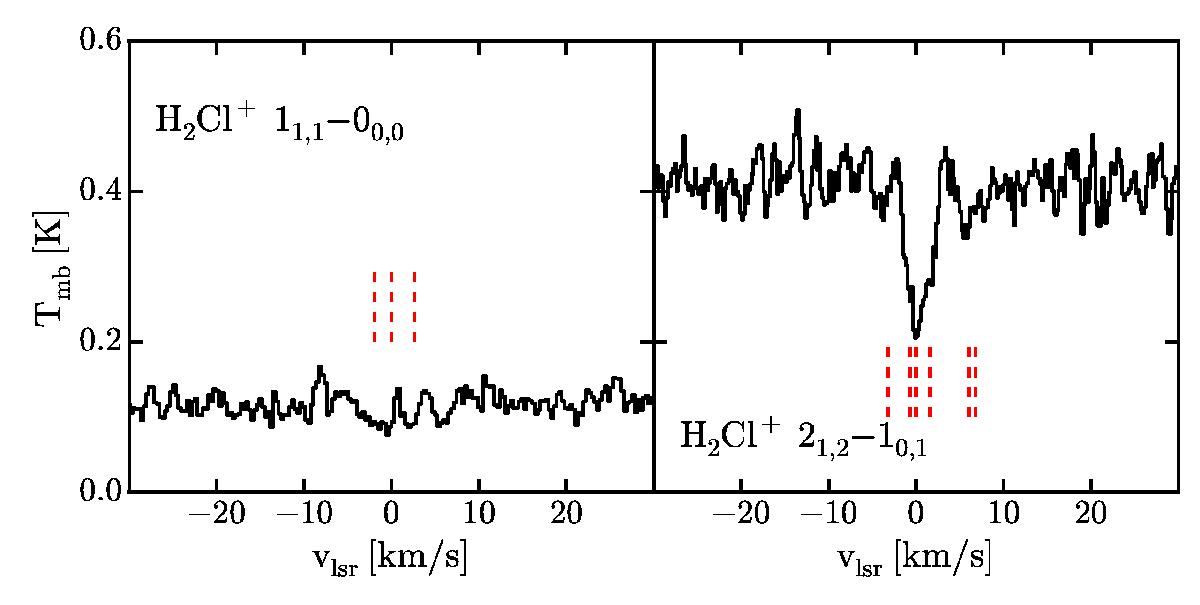
Observed spectra of H2Cl+ from Herschel/HIFI. Only the lines formally detected in absorption are shown, and are velocity-corrected and centred on the strongest hyperfine component. Red dashed lines indicate the hyperfine components of the rotational transitions. The continuum has not been subtracted. See also Fig. B.1.
Current usage metrics show cumulative count of Article Views (full-text article views including HTML views, PDF and ePub downloads, according to the available data) and Abstracts Views on Vision4Press platform.
Data correspond to usage on the plateform after 2015. The current usage metrics is available 48-96 hours after online publication and is updated daily on week days.
Initial download of the metrics may take a while.