Fig. B.1
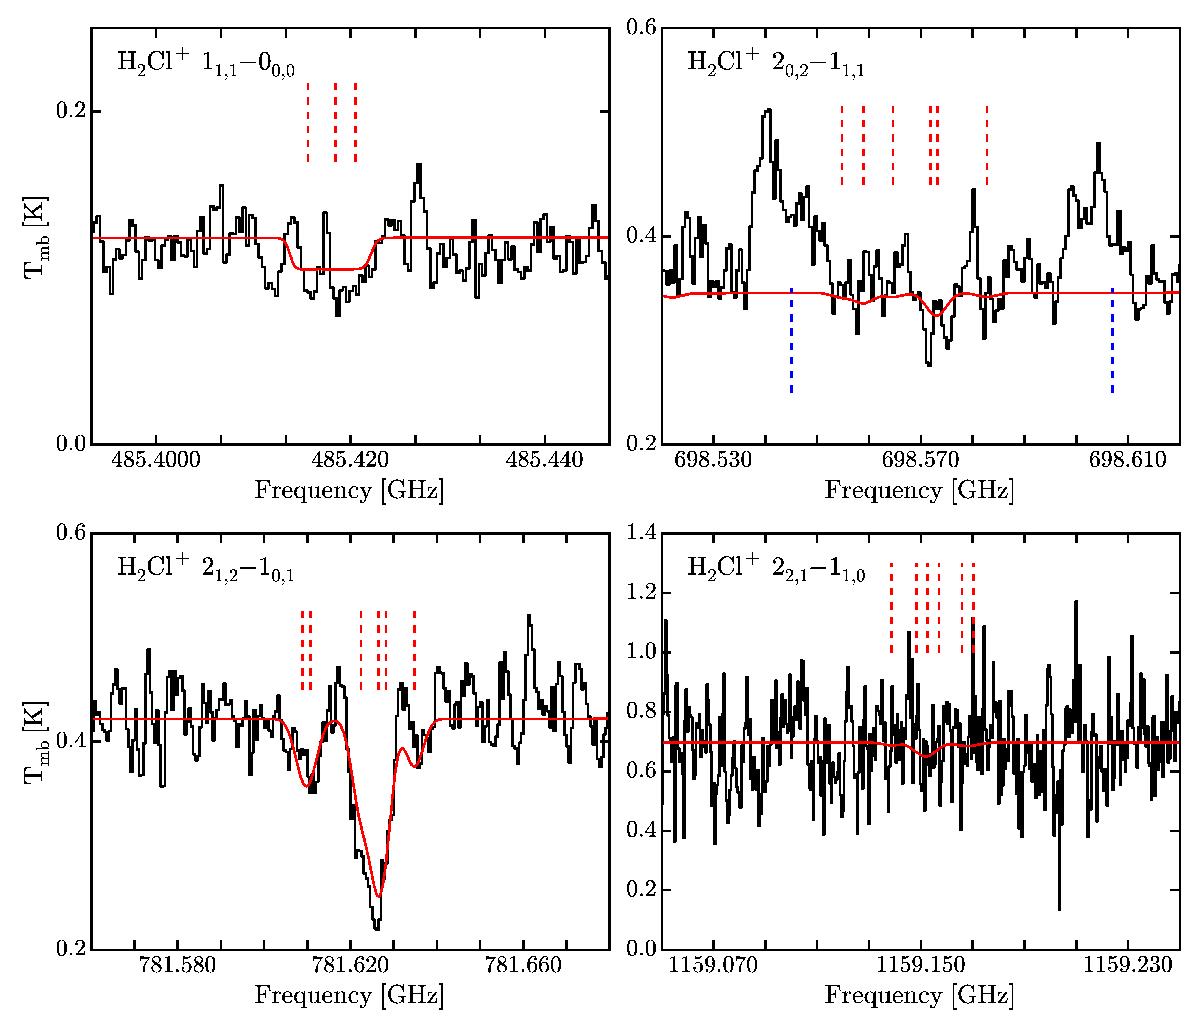
The four H2Cl+ lines (black) used in the LTE model fitting with CASSIS, and the best-fit model (red). All spectra are corrected for the foreground PDR velocity of 9.4 km s-1. The dashed red lines show the hyperfine components of H2Cl+ transitions, while dashed blue lines in the top right panel indicate the native frequencies of C2H transitions. The other H2Cl+ transitions do not have any lines nearby that were listed as detections in the spectral survey of Kama et al. (2013).
Current usage metrics show cumulative count of Article Views (full-text article views including HTML views, PDF and ePub downloads, according to the available data) and Abstracts Views on Vision4Press platform.
Data correspond to usage on the plateform after 2015. The current usage metrics is available 48-96 hours after online publication and is updated daily on week days.
Initial download of the metrics may take a while.