Fig. 5
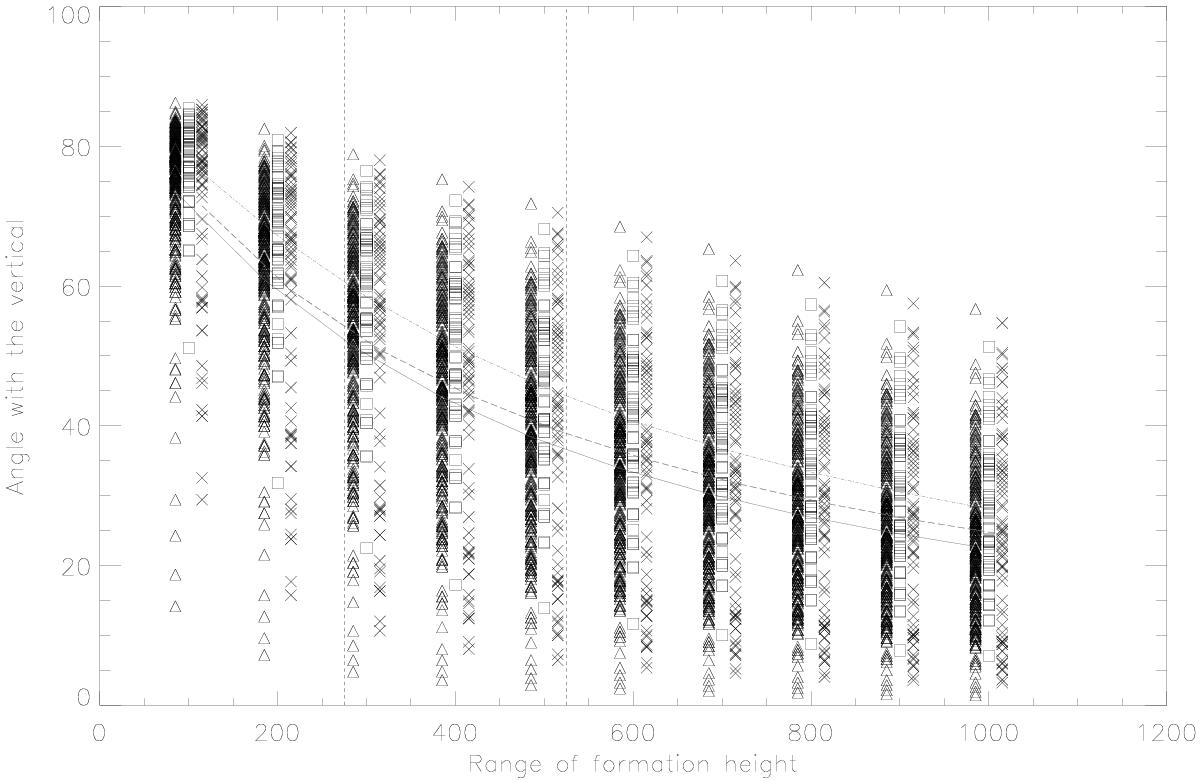
Angle with the vertical versus formation-height range for all structures measured and all spots, with triangles standing for structures measured in Spot A, squares for Spot B, and crosses for Spot C. The symbols are shifted 15 km left for Spot A and 15 km right for Spot C for visibility. The inclination angle is plotted for each individual structure as a function of potential formation range. The vertical lines delimit the range of formation heights we expect from Bard & Carlsson (2010). The solid line (lowest) connects the average angles for Spot A, the dashed line connects the average angles for Spot C (middle line), and the dash-dotted line the average for Spot B.
Current usage metrics show cumulative count of Article Views (full-text article views including HTML views, PDF and ePub downloads, according to the available data) and Abstracts Views on Vision4Press platform.
Data correspond to usage on the plateform after 2015. The current usage metrics is available 48-96 hours after online publication and is updated daily on week days.
Initial download of the metrics may take a while.