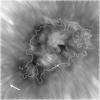
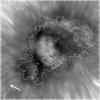
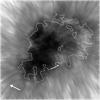
Fig. 4
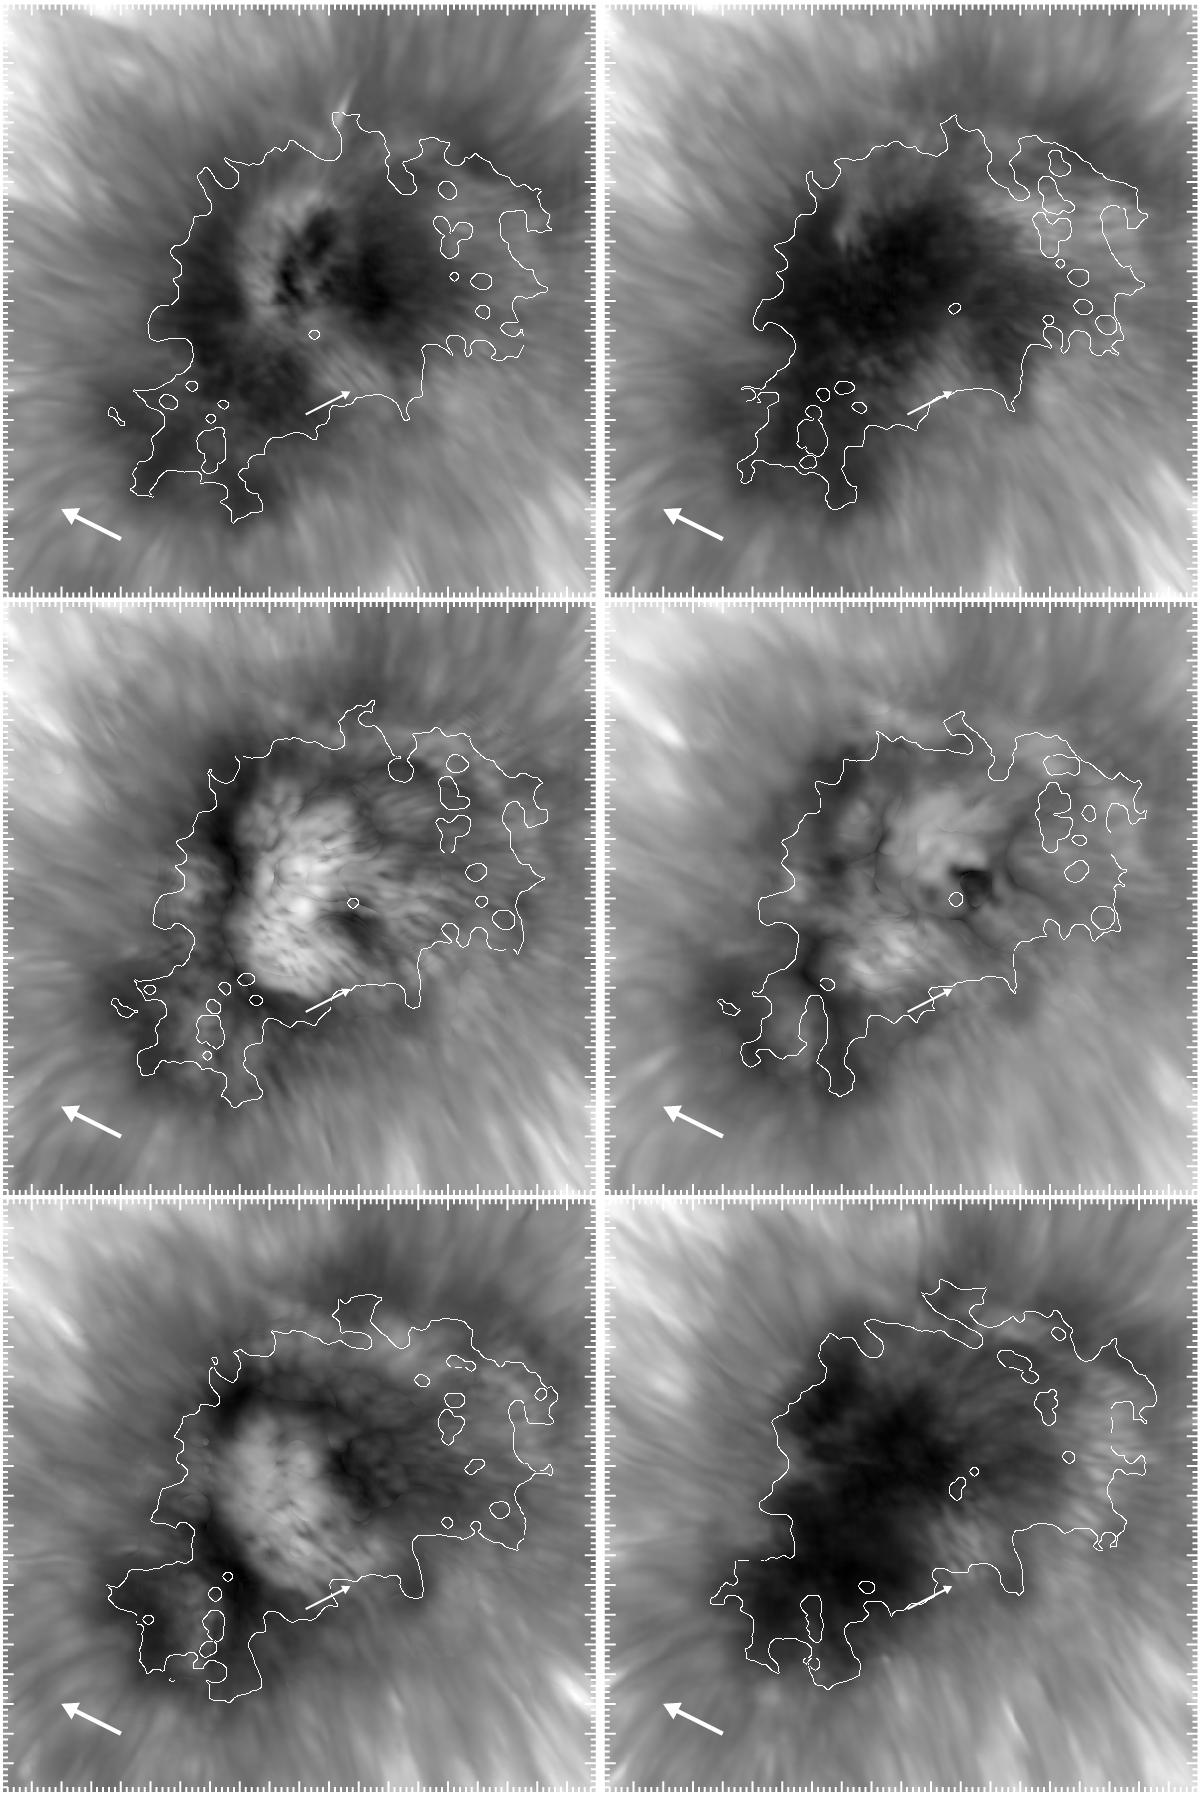
Each image in this panel is a different flash from Spot C at t = 11.20, 14.42, 16.80, 19.60, 21.98, 30.52 min from the top left to the bottom right. Log-scale was used. The bottom arrow indicates the disk-centre direction. The centre arrow points to an UCF selected from the top left panel. The times t = 16.80, t = 19.60, and t = 16.80 min were composed using the technique described in Sect. 2.1. The frames without composition are shown in the online movie. Major tickmarks every 1′′.
Current usage metrics show cumulative count of Article Views (full-text article views including HTML views, PDF and ePub downloads, according to the available data) and Abstracts Views on Vision4Press platform.
Data correspond to usage on the plateform after 2015. The current usage metrics is available 48-96 hours after online publication and is updated daily on week days.
Initial download of the metrics may take a while.