Free Access
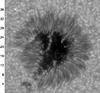
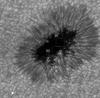
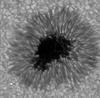
Fig. 1
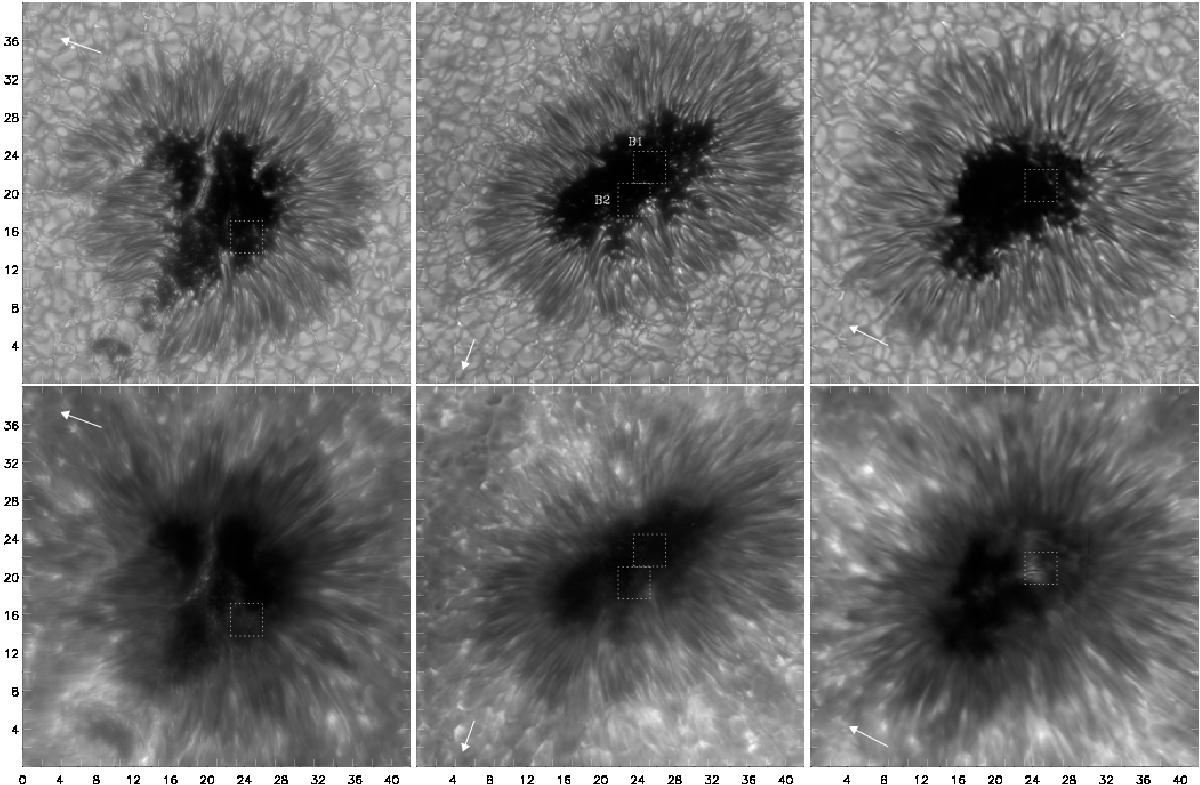
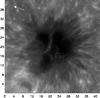
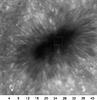
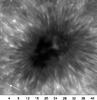
Three sunspots analysed in this work. Top row: wideband images and bottom row: Ca II H core filter images. The arrows point towards the solar disk centre. The field of view is 42 × 42′′ with tickmarks at 2′′intervals. The boxes delimit the regions of interest shown in Fig. 2.
This figure is made of several images, please see below:
Current usage metrics show cumulative count of Article Views (full-text article views including HTML views, PDF and ePub downloads, according to the available data) and Abstracts Views on Vision4Press platform.
Data correspond to usage on the plateform after 2015. The current usage metrics is available 48-96 hours after online publication and is updated daily on week days.
Initial download of the metrics may take a while.