Fig. 6
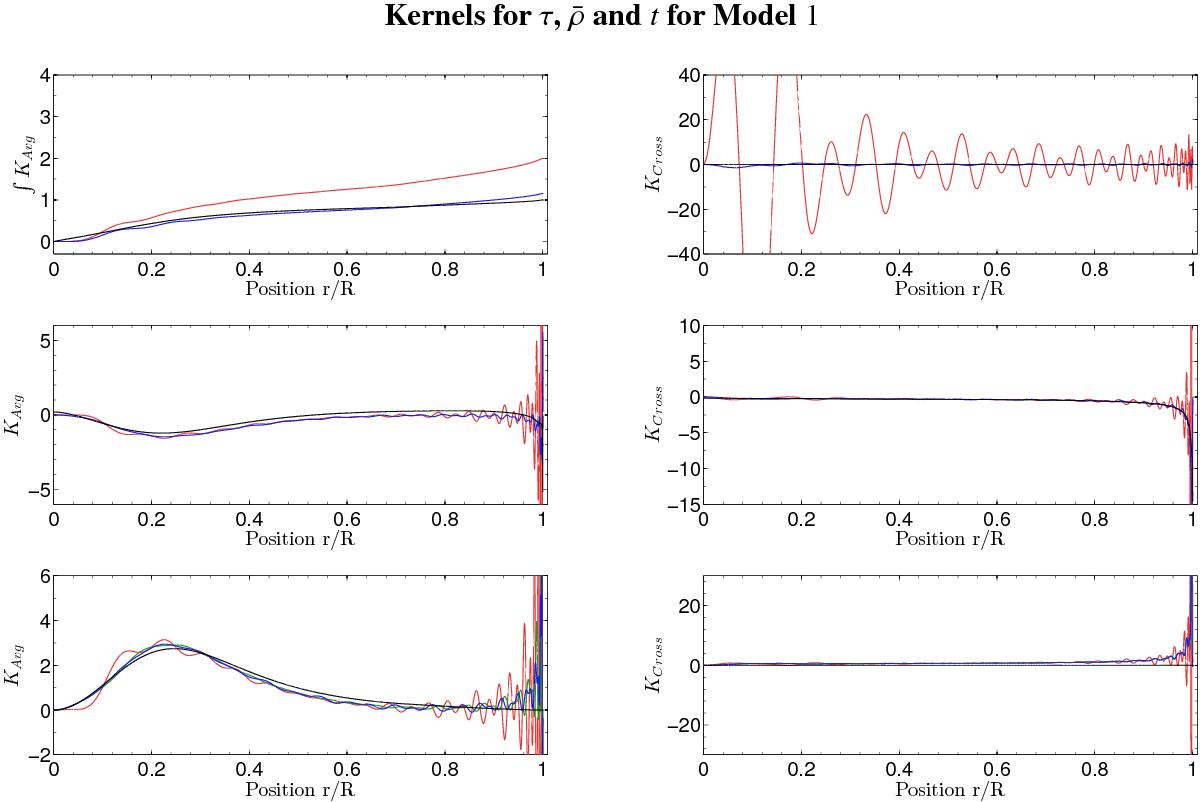
Kernels for the test case with different metallicity. Averaging kernels (left) and cross-term kernels (right) for the age indicator inversion (top panels), the acoustic radius inversion (middle panels), and the mean density (lower panels). The SOLA method is in blue, the ⟨Δν⟩ estimate in red and when implemented, the KBCD approach is in green. The target function in all panels is plotted in black. (Colour online.)
Current usage metrics show cumulative count of Article Views (full-text article views including HTML views, PDF and ePub downloads, according to the available data) and Abstracts Views on Vision4Press platform.
Data correspond to usage on the plateform after 2015. The current usage metrics is available 48-96 hours after online publication and is updated daily on week days.
Initial download of the metrics may take a while.