Fig. 5
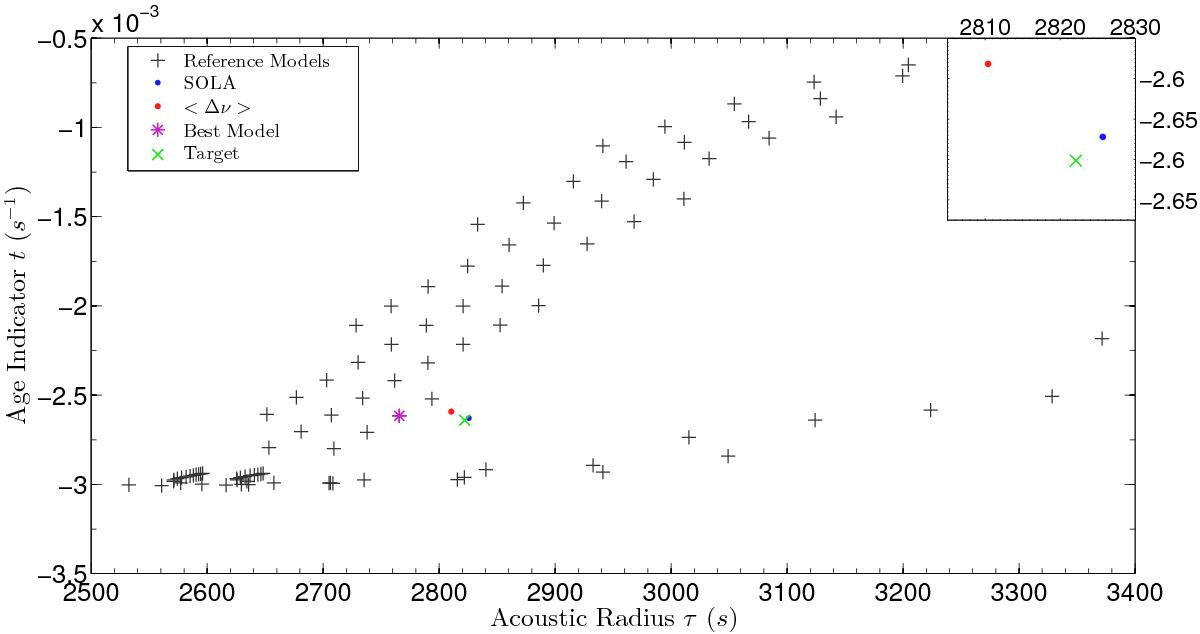
Inversion results for the model with the best small frequency separation. In the main part of the figure, the grid models are represented by the black +, the best model is the purple ∗, model A′ the green X, the SOLA result is in blue, and the large frequency separation result in red. The inset shows an enlarged view of the region around model A′.
Current usage metrics show cumulative count of Article Views (full-text article views including HTML views, PDF and ePub downloads, according to the available data) and Abstracts Views on Vision4Press platform.
Data correspond to usage on the plateform after 2015. The current usage metrics is available 48-96 hours after online publication and is updated daily on week days.
Initial download of the metrics may take a while.