Fig. 4
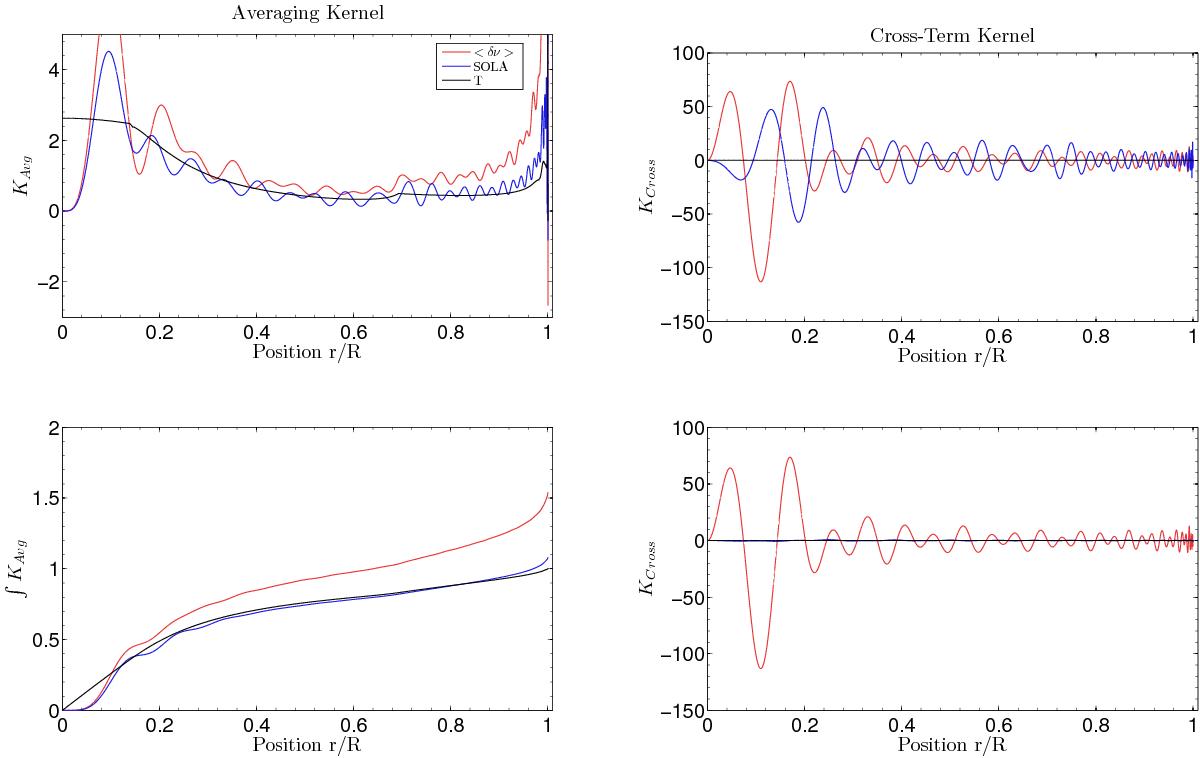
Upper panels: averaging and cross-term kernels for the model with the best small frequency separation by optimising on the averaging kernel itself. Lower panels: same results by optimising the anti-derivative of the averaging kernel. The target function is in black, the results for the small frequency separation estimate in red and those for SOLA inversions in blue.
Current usage metrics show cumulative count of Article Views (full-text article views including HTML views, PDF and ePub downloads, according to the available data) and Abstracts Views on Vision4Press platform.
Data correspond to usage on the plateform after 2015. The current usage metrics is available 48-96 hours after online publication and is updated daily on week days.
Initial download of the metrics may take a while.