Fig. 1
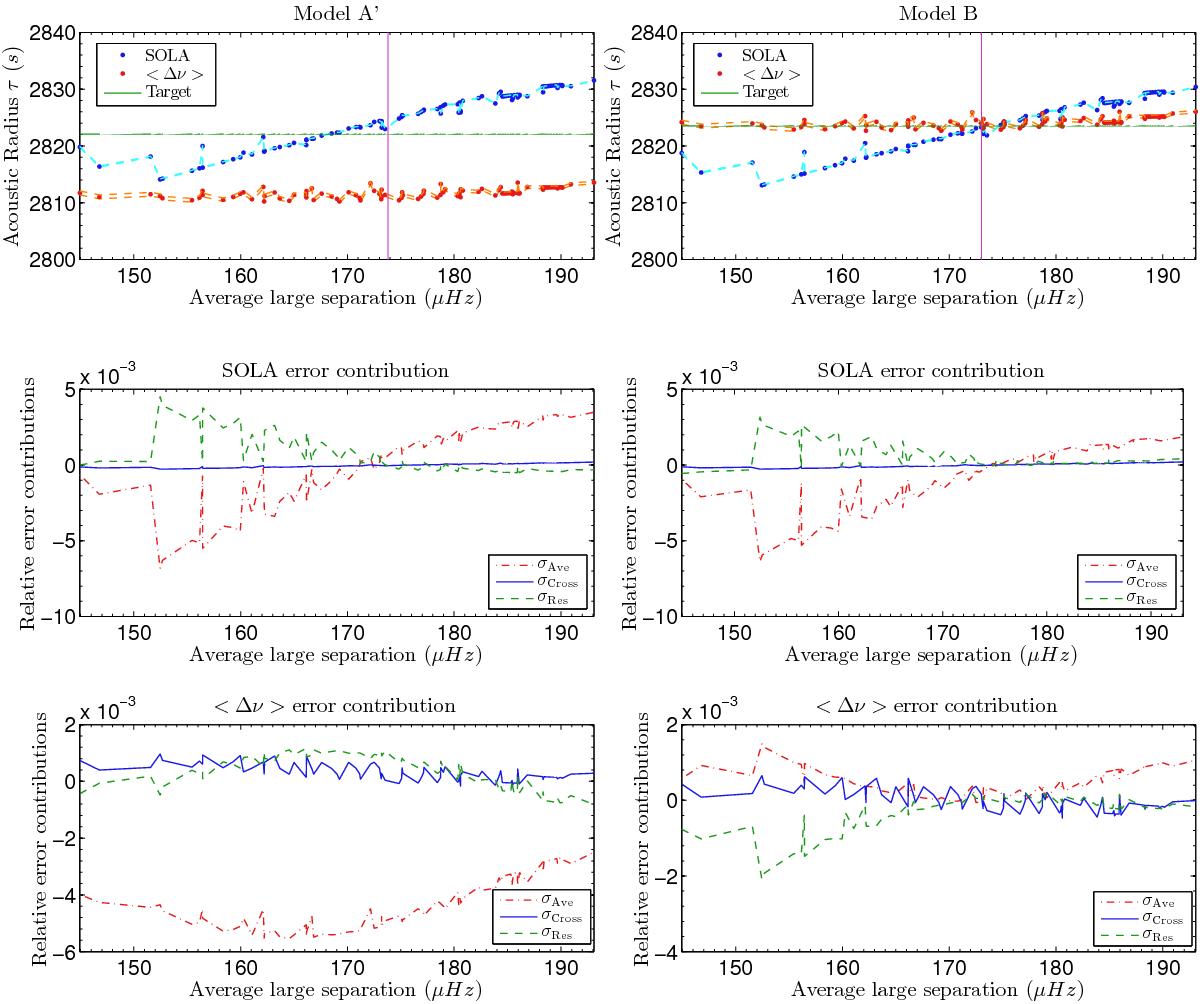
Left-hand panels: inversion results for model A′, whereas the right-hand side is for model B. Top panels: SOLA inversion results (blue) and estimates based on the large frequency separation (red), the vertical line (magenta) indicates the value of the large frequency separation of each target. The figures below show the different error from Eq. (10) terms, which appear in the SOLA inversions (middle panels) and the large separation (lower panels). The results and error contributions are given for every model of the grid such that the abscissa of these figures is the average large separation of each reference model.
Current usage metrics show cumulative count of Article Views (full-text article views including HTML views, PDF and ePub downloads, according to the available data) and Abstracts Views on Vision4Press platform.
Data correspond to usage on the plateform after 2015. The current usage metrics is available 48-96 hours after online publication and is updated daily on week days.
Initial download of the metrics may take a while.