Fig. 5
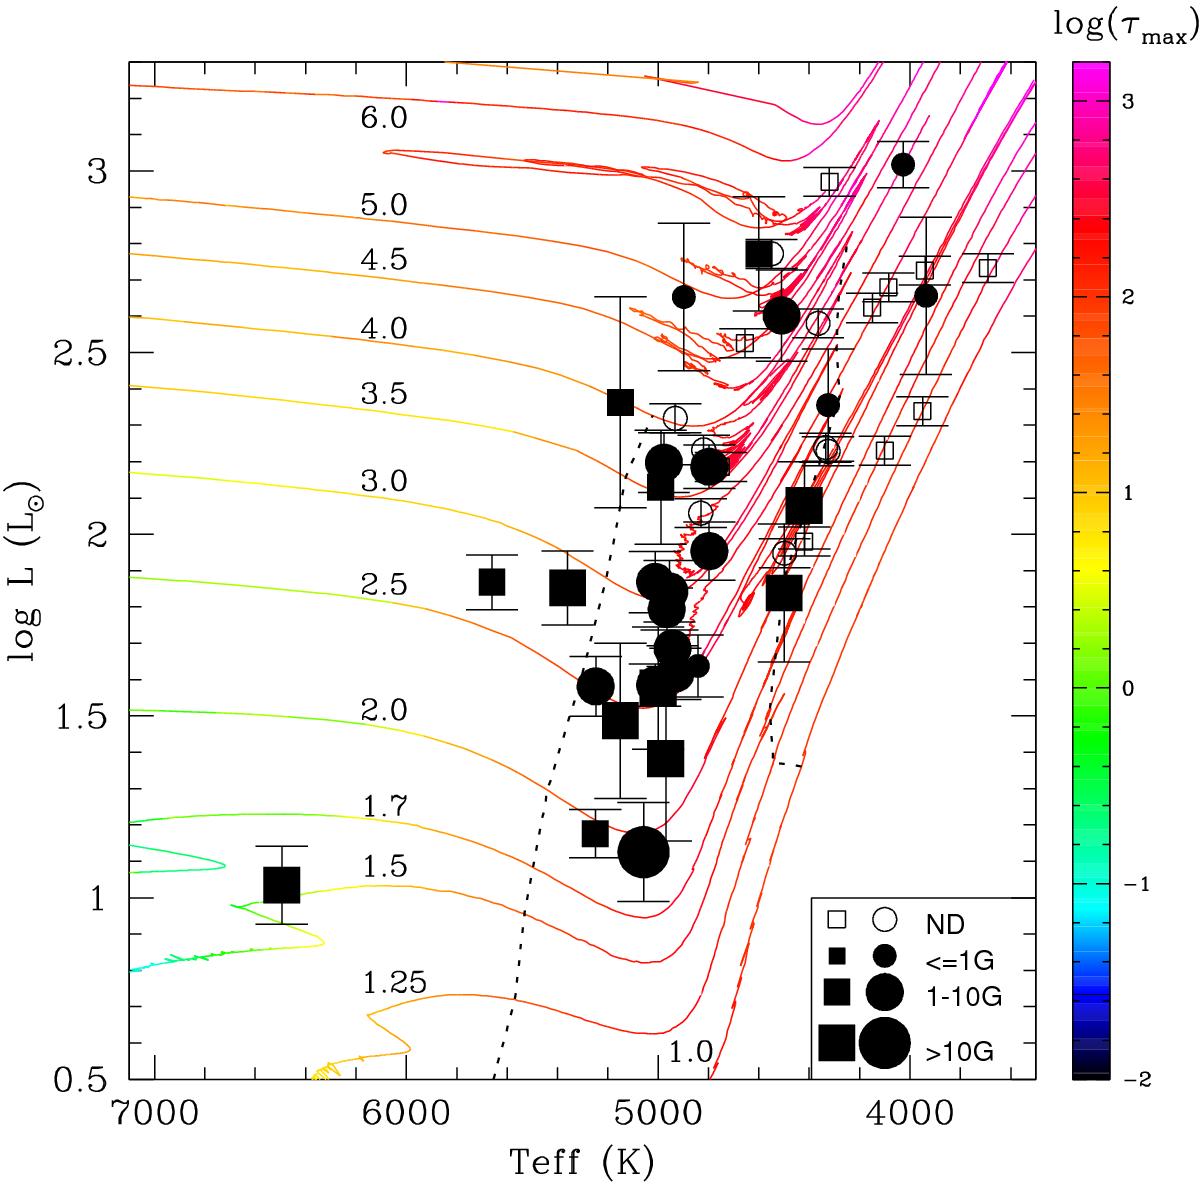
Position of our sample stars in the Hertzsprung-Russell diagram. Solar metallicity tracks with rotation of Charbonnel & Lagarde (2010) and Charbonnel et al. (in prep.) are shown up to the RGB tip for the low-mass stars (below 2 M⊙), and up to the AGB phase for the intermediate-mass stars. The initial mass of the star (in M⊙) is indicated for each track. The color scale indicates the value of the maximum convective turnover time within the convective envelope τ(max). The dotted lines delimit the boundaries of the first dredge up phase, which correspond respectively to the evolutionary points when the mass of the convective envelope encompasses 2.5% of the total stellar mass, and when the convective envelope starts withdrawing in mass at the end of the first dredge-up. Circles correspond to stars which are in Massarotti et al. (2008) and squares correspond to other stars, as explained in the text.
Current usage metrics show cumulative count of Article Views (full-text article views including HTML views, PDF and ePub downloads, according to the available data) and Abstracts Views on Vision4Press platform.
Data correspond to usage on the plateform after 2015. The current usage metrics is available 48-96 hours after online publication and is updated daily on week days.
Initial download of the metrics may take a while.