Free Access
Fig. C.1
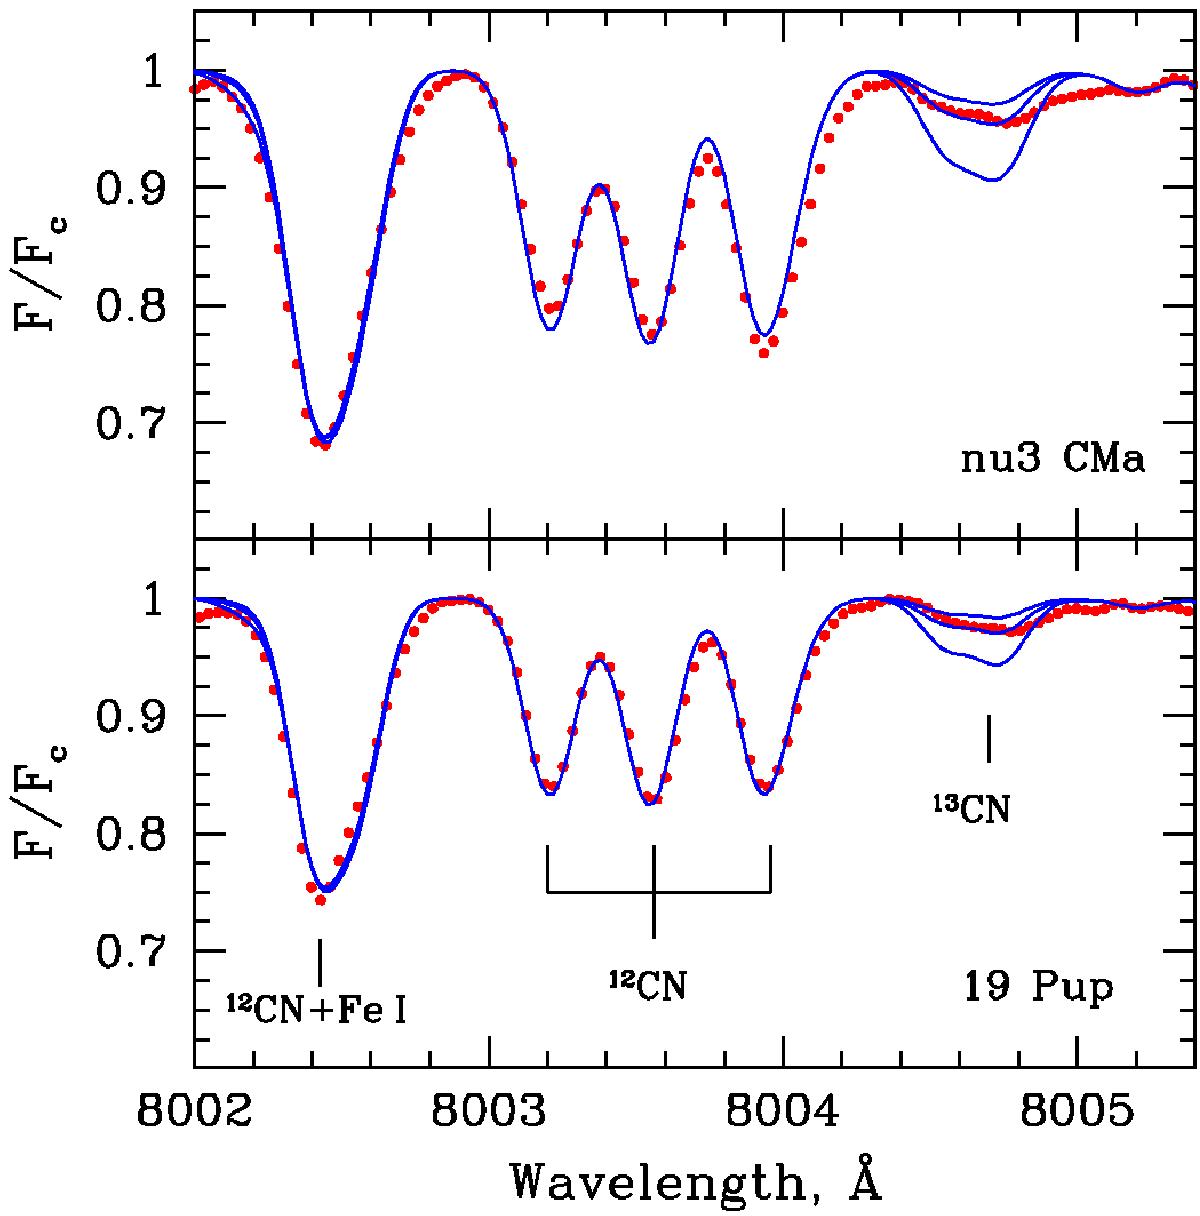
Observed (dotted red line) and synthetic (solid blue line) spectra in the region around the 12CN and 13CN lines at ~8004 Å for ν3 CMa (top) and 19 Pup (bottom). Synthetic spectra were calculated for three 12C/13C ratios, 10.0, 22.0, and 36.0 for ν3 CMa and 10.0, 20.0, and 36.0 for 19 Pup.
Current usage metrics show cumulative count of Article Views (full-text article views including HTML views, PDF and ePub downloads, according to the available data) and Abstracts Views on Vision4Press platform.
Data correspond to usage on the plateform after 2015. The current usage metrics is available 48-96 hours after online publication and is updated daily on week days.
Initial download of the metrics may take a while.