Fig. 2
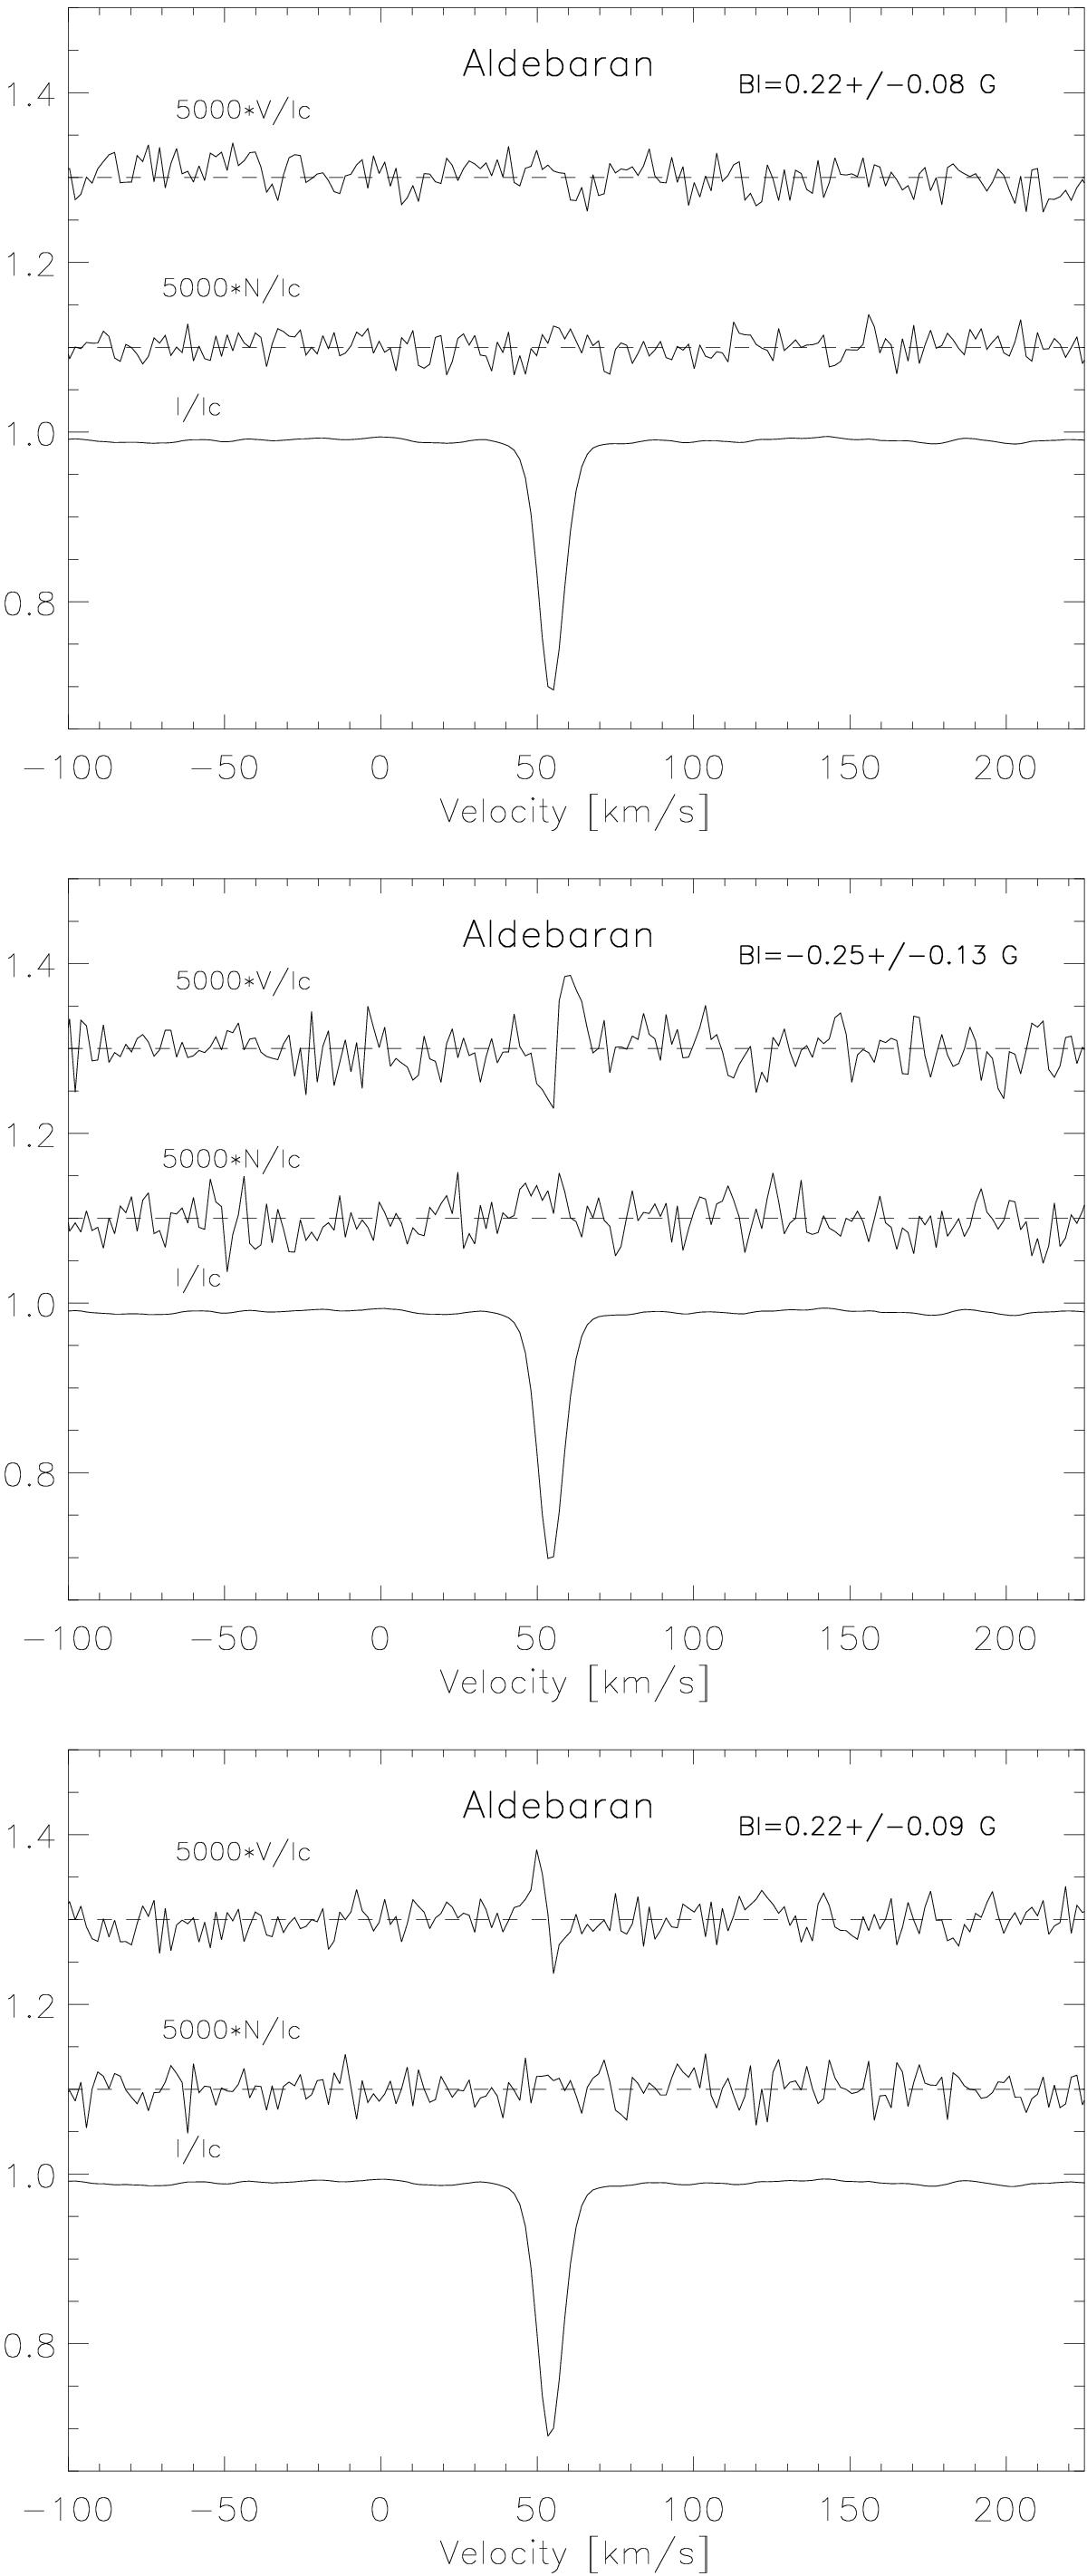
LSD profiles of Aldebaran as observed with Narval on 14–15 March 2010 (upper panel), 5 October 2010 (middle panel) and 16 January 2011 (lower panel). For each graph, from top to bottom are Stokes V, null polarisation N, and Stokes I profiles. For display purposes, the profiles are shifted vertically, and the Stokes V and diagnostic N profiles are expanded by a factor of 5000. The dashed lines illustrate the zero level for the Stokes V and diagnostic null profiles. The Stokes V profiles illustrate a non detection (ND) on 14–15 March 2010, then definite detections (DD) with a change of polarity of the magnetic field between the two later dates.
Current usage metrics show cumulative count of Article Views (full-text article views including HTML views, PDF and ePub downloads, according to the available data) and Abstracts Views on Vision4Press platform.
Data correspond to usage on the plateform after 2015. The current usage metrics is available 48-96 hours after online publication and is updated daily on week days.
Initial download of the metrics may take a while.