Fig. A.1
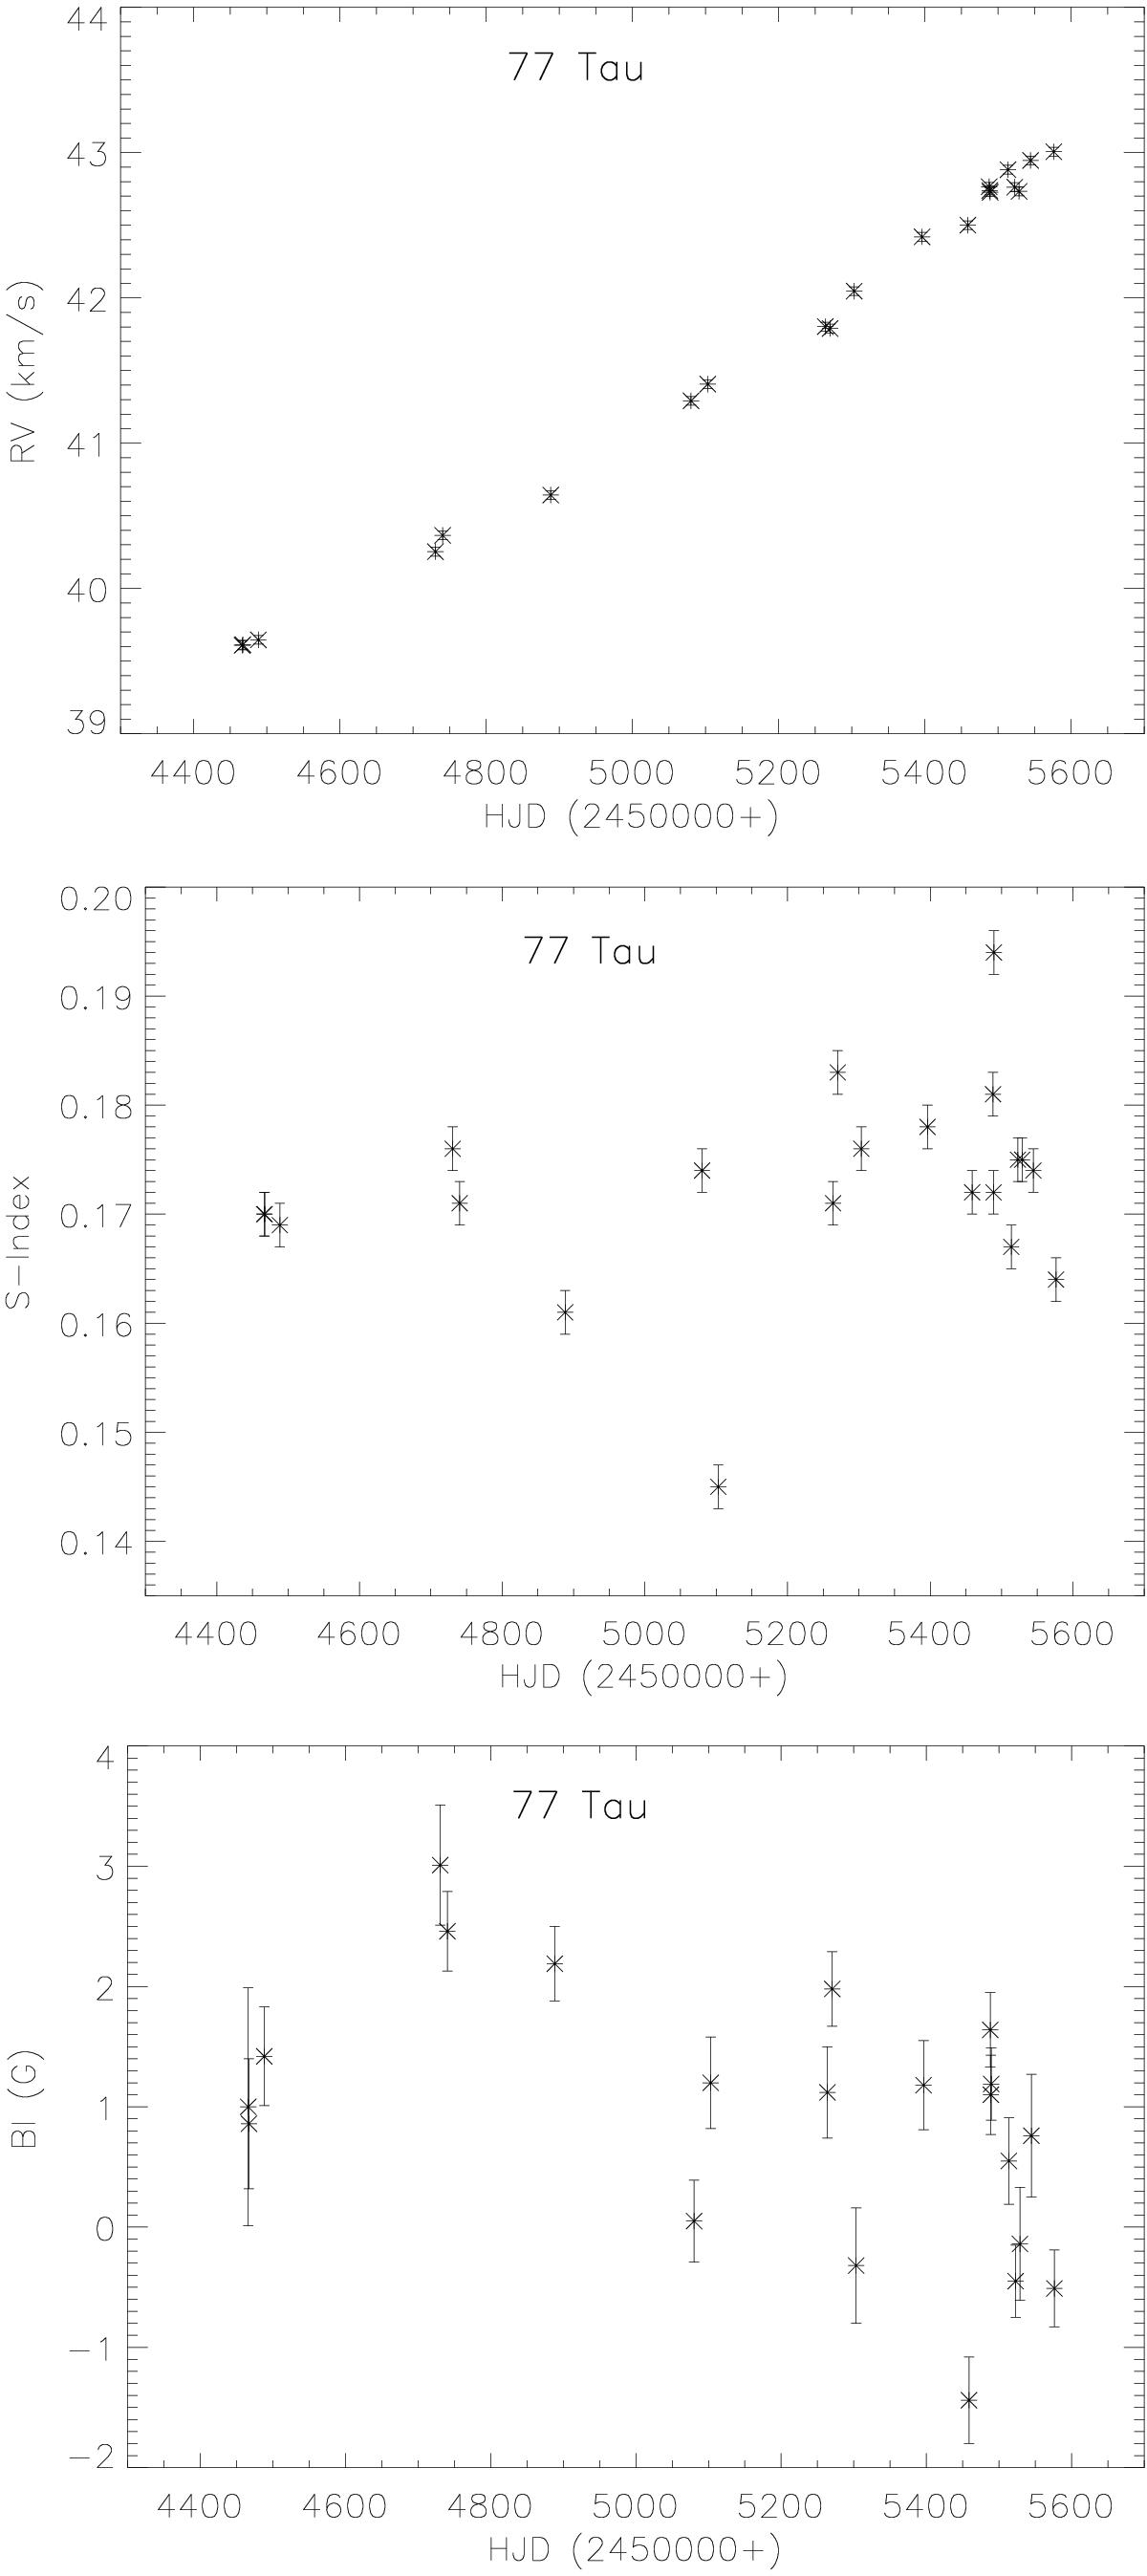
Variations of the radial velocity (RV, upper graph), S-index (middle graph) and longitudinal magnetic field (Bl, lower graph) of 77 Tau between 31 December 2007 and 14 January 2011, as observed with Narval and ESPaDOnS. Error bars of 30 m/s and 0.05 are illustrated for RV and S-index respectively. As to the Bl plot, error bars are those of Table 1.
Current usage metrics show cumulative count of Article Views (full-text article views including HTML views, PDF and ePub downloads, according to the available data) and Abstracts Views on Vision4Press platform.
Data correspond to usage on the plateform after 2015. The current usage metrics is available 48-96 hours after online publication and is updated daily on week days.
Initial download of the metrics may take a while.