Fig. 3
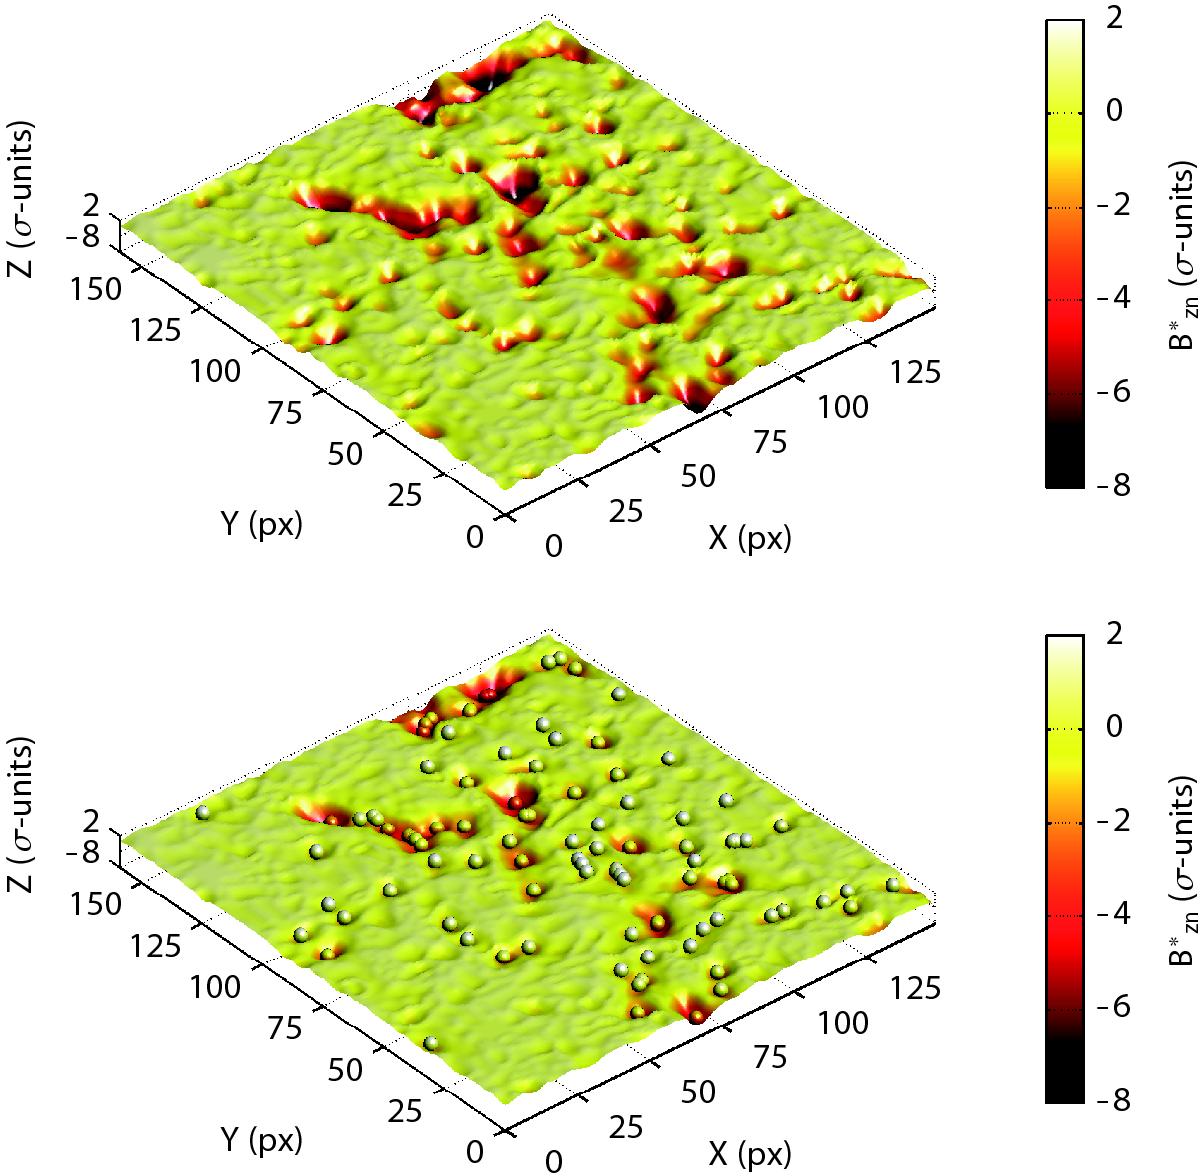
Top: Bzn∗ in 3D, using the same data as in the bottom of Fig. 2, with the intensity used as a geometrical height. The colourmap is scaled exactly as the intensity. Bottom: same as the top figure, with balls that have settled in the “magnetic holes” after a few integration steps. The position of these balls on the original 2D magnetograms are shown in Fig. 4.
Current usage metrics show cumulative count of Article Views (full-text article views including HTML views, PDF and ePub downloads, according to the available data) and Abstracts Views on Vision4Press platform.
Data correspond to usage on the plateform after 2015. The current usage metrics is available 48-96 hours after online publication and is updated daily on week days.
Initial download of the metrics may take a while.