Fig. 12
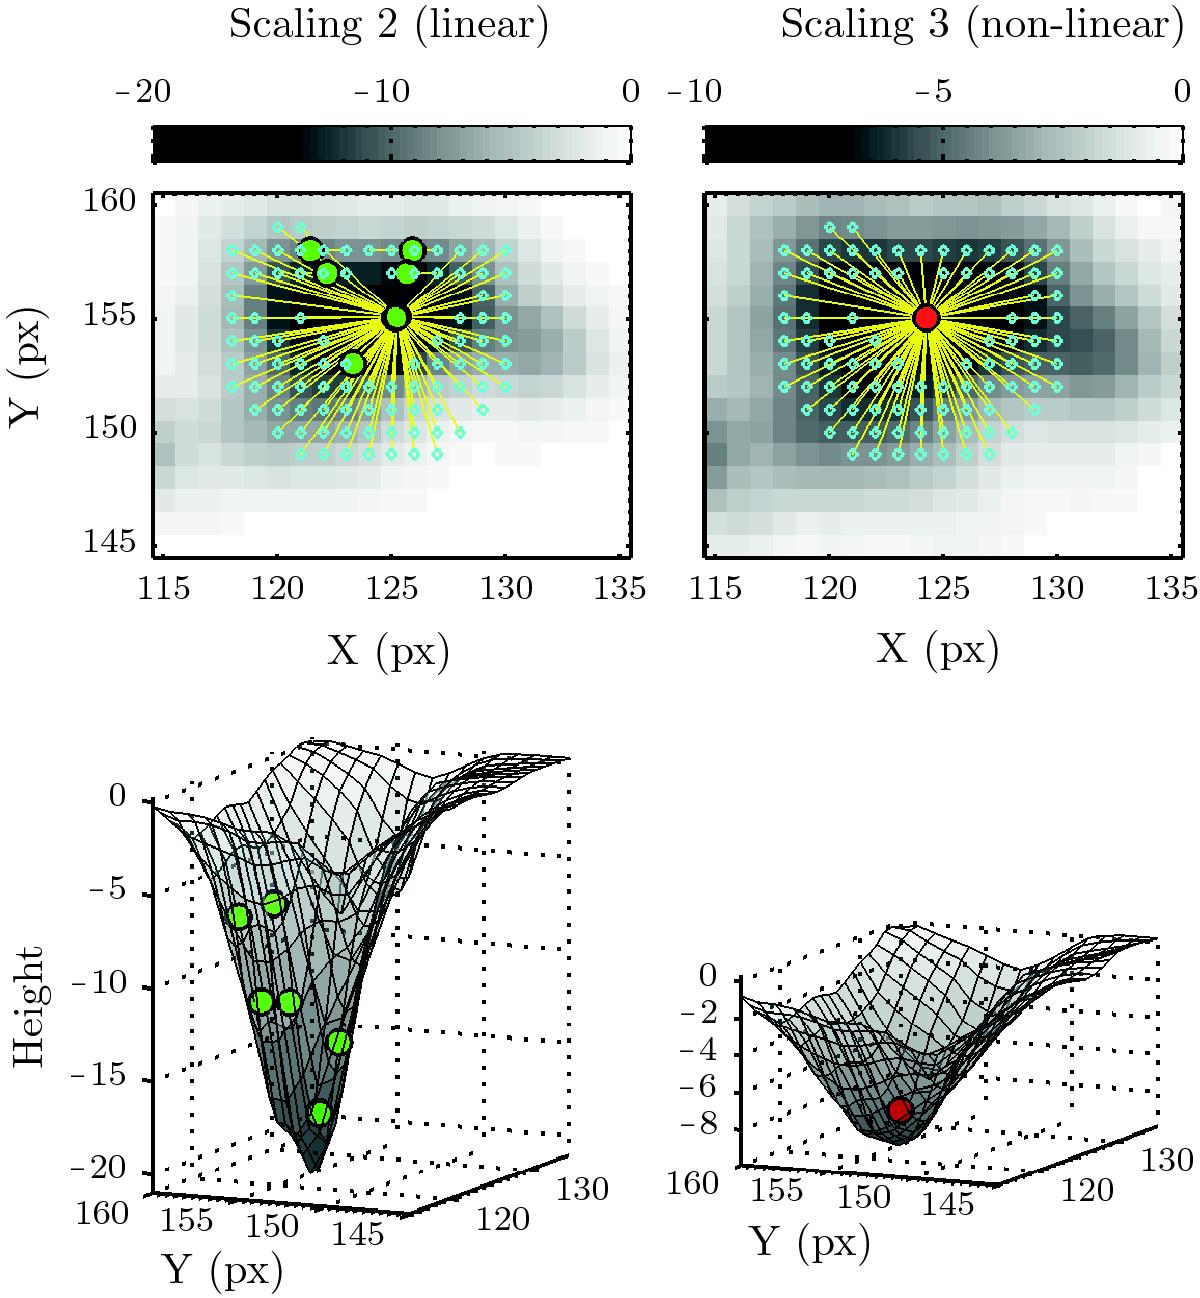
Close-up in the region of the yellow rectangle in Fig. 9. Left: linear rescaling (Method 2). Right: non-linear rescaling (Method 3). The small cyan dots are the initial positions. The coloured circles are the final positions. The yellow lines are mapping the final position to the corresponding initial positions. They are not the actual trajectories. Bottom: 3D data surface viewed from the left Y-axis.
Current usage metrics show cumulative count of Article Views (full-text article views including HTML views, PDF and ePub downloads, according to the available data) and Abstracts Views on Vision4Press platform.
Data correspond to usage on the plateform after 2015. The current usage metrics is available 48-96 hours after online publication and is updated daily on week days.
Initial download of the metrics may take a while.