Free Access
Fig. 1
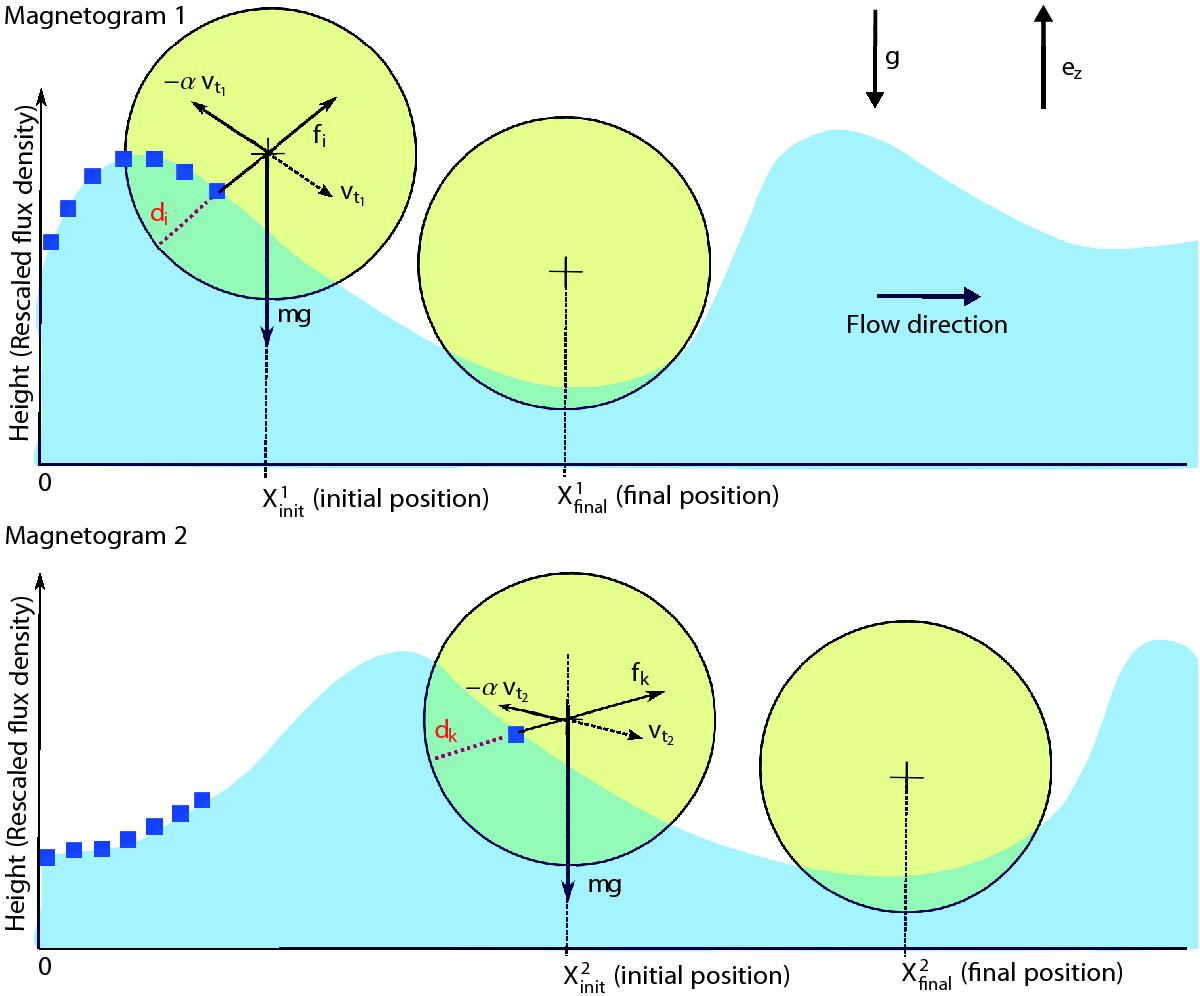
General concept of the balltracking algorithm for one ball. The blue squares represent the pixels drawn at a height equal to the rescaled value of the unsigned flux density so that maxima in flux density appear as local minima. Only a few pixels are represented.
Current usage metrics show cumulative count of Article Views (full-text article views including HTML views, PDF and ePub downloads, according to the available data) and Abstracts Views on Vision4Press platform.
Data correspond to usage on the plateform after 2015. The current usage metrics is available 48-96 hours after online publication and is updated daily on week days.
Initial download of the metrics may take a while.