Fig. 7
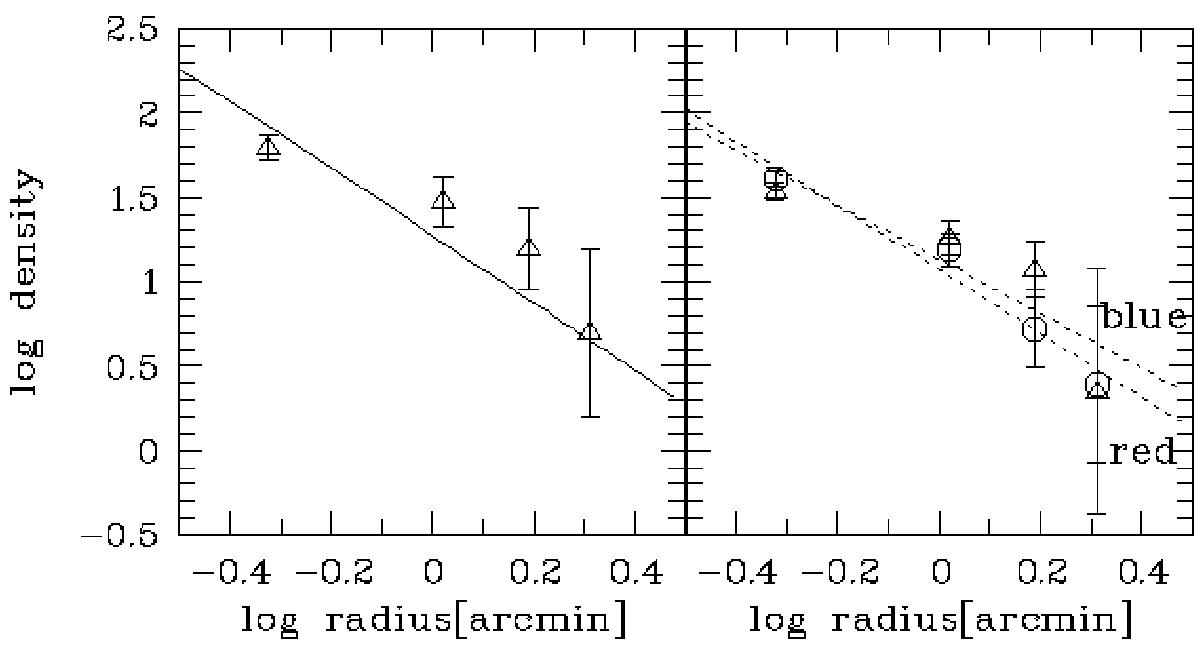
Left panel: density profile (logarithm of numbers per square arcmin) of all GC candidates brighter than R = 25 mag. The straight line is the arbitrarily scaled light profile of the galaxy for showing that these profiles are not distinguishable. Right panel: the density profiles for red (circles) and blue (triangles) clusters separately. The labels “blue” and “red” indicate the respective linear fits. The blue clusters show a marginally shallower profile, but the uncertainties are too large to draw conclusions.
Current usage metrics show cumulative count of Article Views (full-text article views including HTML views, PDF and ePub downloads, according to the available data) and Abstracts Views on Vision4Press platform.
Data correspond to usage on the plateform after 2015. The current usage metrics is available 48-96 hours after online publication and is updated daily on week days.
Initial download of the metrics may take a while.