Fig. 5
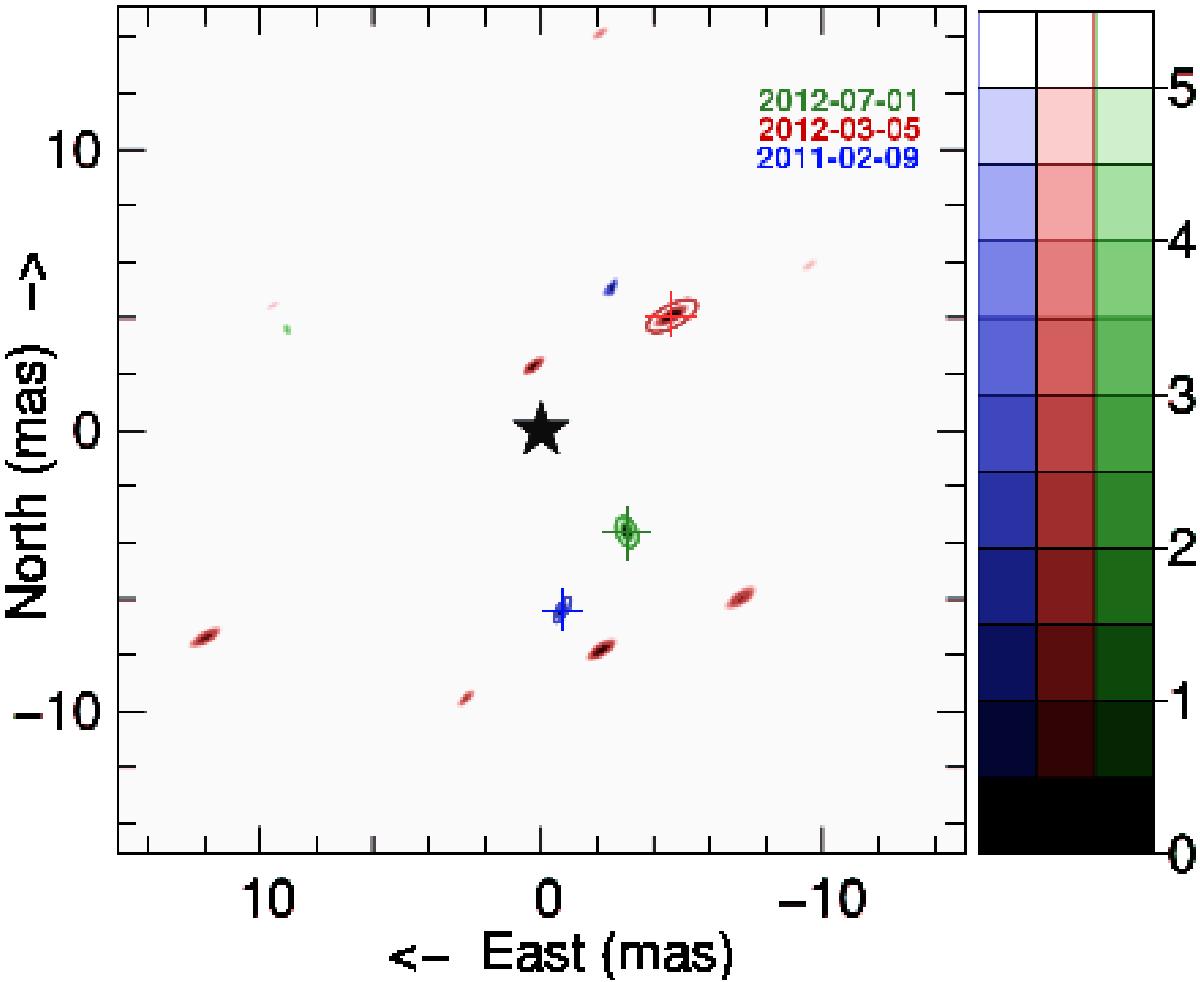
χ2 map for the binary model fitting of WW Cha for the observations of February 2011 (blue), March 2012 (red), and July 2012 (green) (for each colour, darker tones mean better χ2). The primary is represented by the central black star, while the best fit position of WW Cha companion (i.e., the minimum χ2) is denoted by a cross. Observations of March 2012 produced data of lower quality, leading to numerous local minima in this map.
Current usage metrics show cumulative count of Article Views (full-text article views including HTML views, PDF and ePub downloads, according to the available data) and Abstracts Views on Vision4Press platform.
Data correspond to usage on the plateform after 2015. The current usage metrics is available 48-96 hours after online publication and is updated daily on week days.
Initial download of the metrics may take a while.