Fig. 2
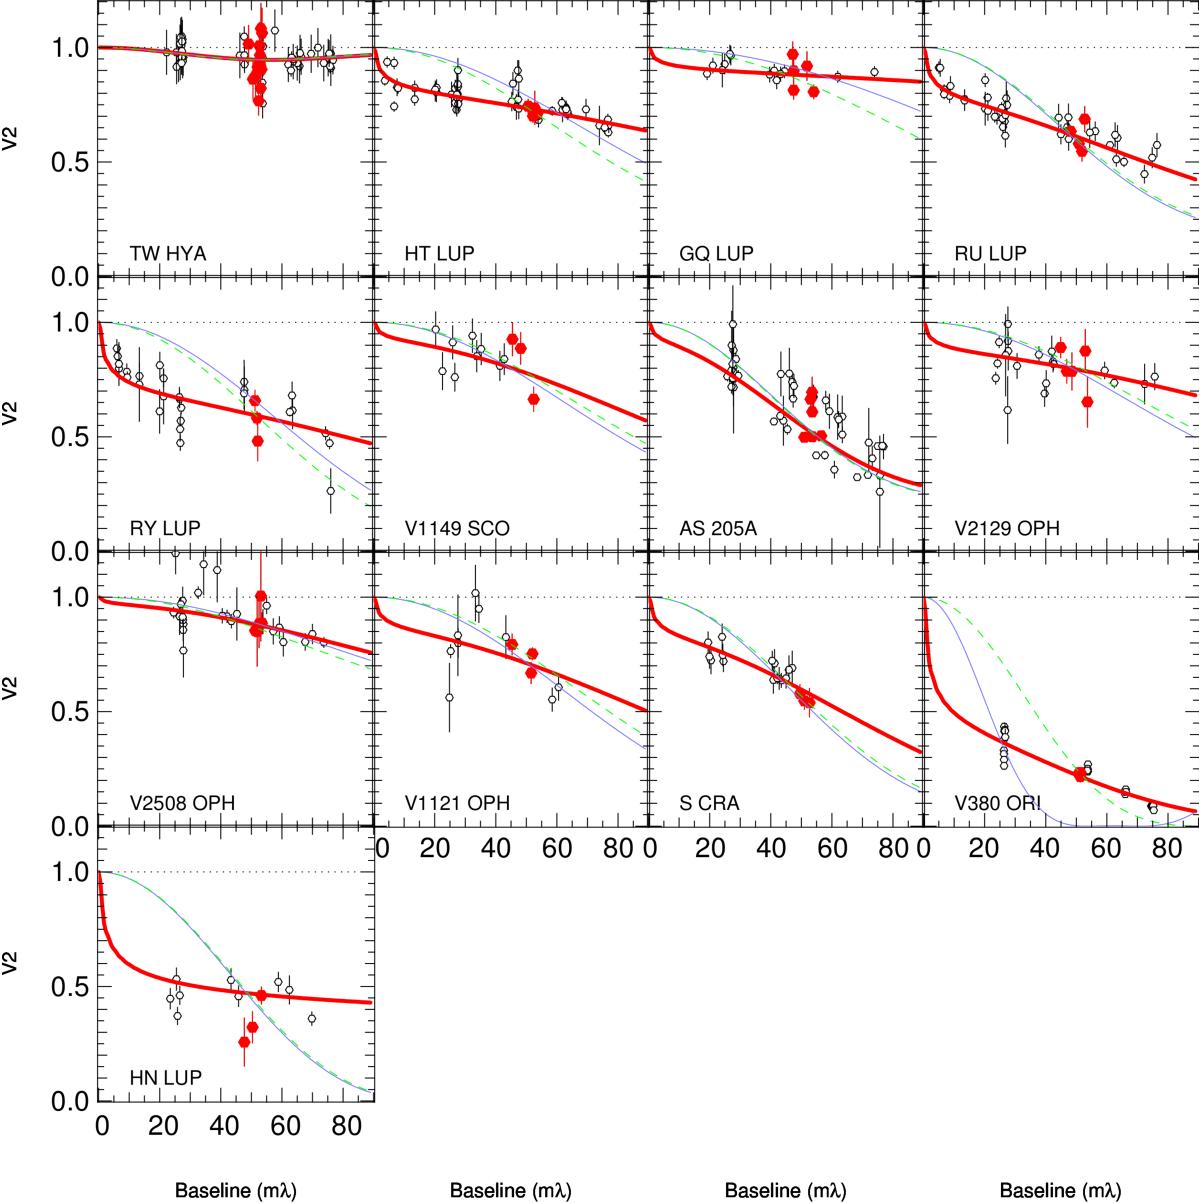
Plots of the results form the visibility modelling with the thermal and composite models. For each star the black circles and vertical bars are the data points and error bars, and the dotted line represents V2 = 1. The red lines are the fits with the composite model, and the blue lines are the fits with the thermal model. Fitting only the visibility point between ~47 and ~54 Mλ (roughly the baseline of the Keck Interferometer, see the red points and error bars) with the thermal model leads to similar results (green dashed line) for the majority of the stars as fitting the whole visibility profile.
Current usage metrics show cumulative count of Article Views (full-text article views including HTML views, PDF and ePub downloads, according to the available data) and Abstracts Views on Vision4Press platform.
Data correspond to usage on the plateform after 2015. The current usage metrics is available 48-96 hours after online publication and is updated daily on week days.
Initial download of the metrics may take a while.