Fig. 1
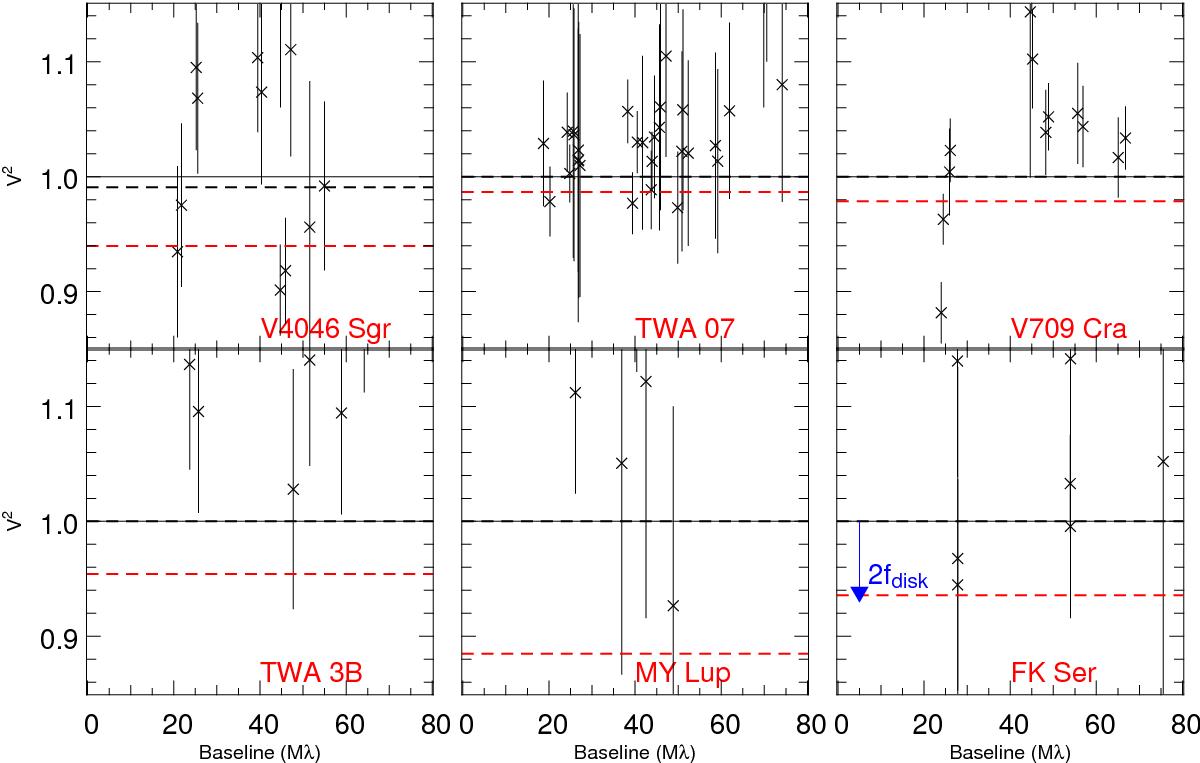
Visibility profile modelling of the unresolved stars of our survey. The visibility data correspond to the black crosses and error bars, while the best visibility fit and lower limit are plotted in dashed black and red lines respectively. The difference between unity and the lower limit can be approximated to two time the maximal fractional luminosity of the disk.
Current usage metrics show cumulative count of Article Views (full-text article views including HTML views, PDF and ePub downloads, according to the available data) and Abstracts Views on Vision4Press platform.
Data correspond to usage on the plateform after 2015. The current usage metrics is available 48-96 hours after online publication and is updated daily on week days.
Initial download of the metrics may take a while.