Free Access
Fig. 25
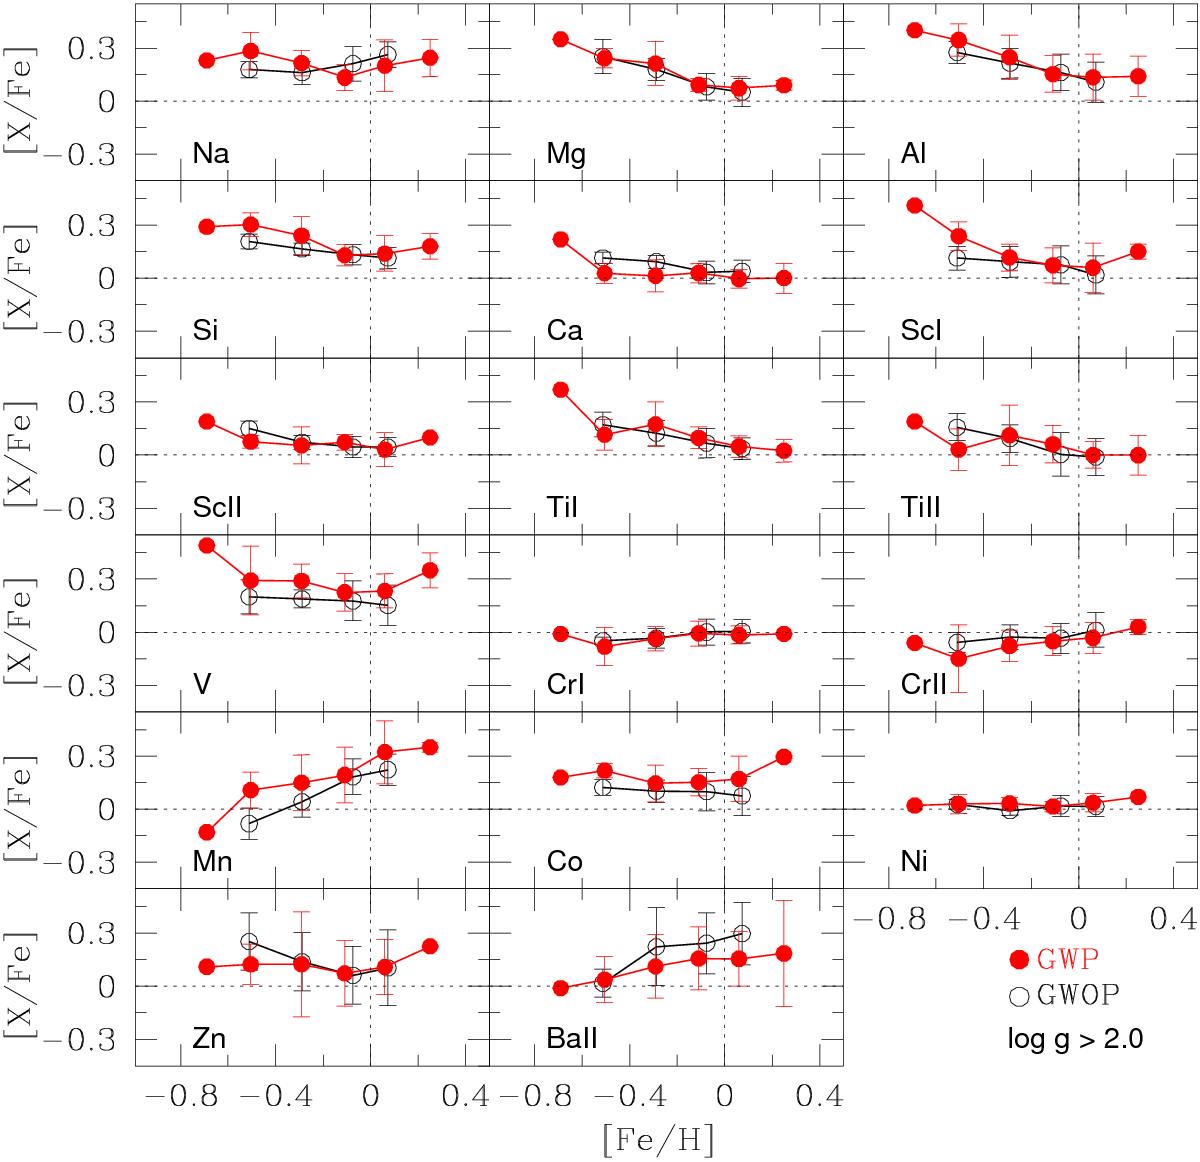
Same plot as Fig. 24, but data is averaged in [Fe/H] bins of 0.2 dex, centered at −0.6, −0.4, −0.2, 0.0, 0.2, and 0.4 dex. Low-gravity stars (log g< 2.0) have been removed. Dashed lines represent the solar values. The error bars represent the standard deviation about the mean value.
Current usage metrics show cumulative count of Article Views (full-text article views including HTML views, PDF and ePub downloads, according to the available data) and Abstracts Views on Vision4Press platform.
Data correspond to usage on the plateform after 2015. The current usage metrics is available 48-96 hours after online publication and is updated daily on week days.
Initial download of the metrics may take a while.