Fig. 12
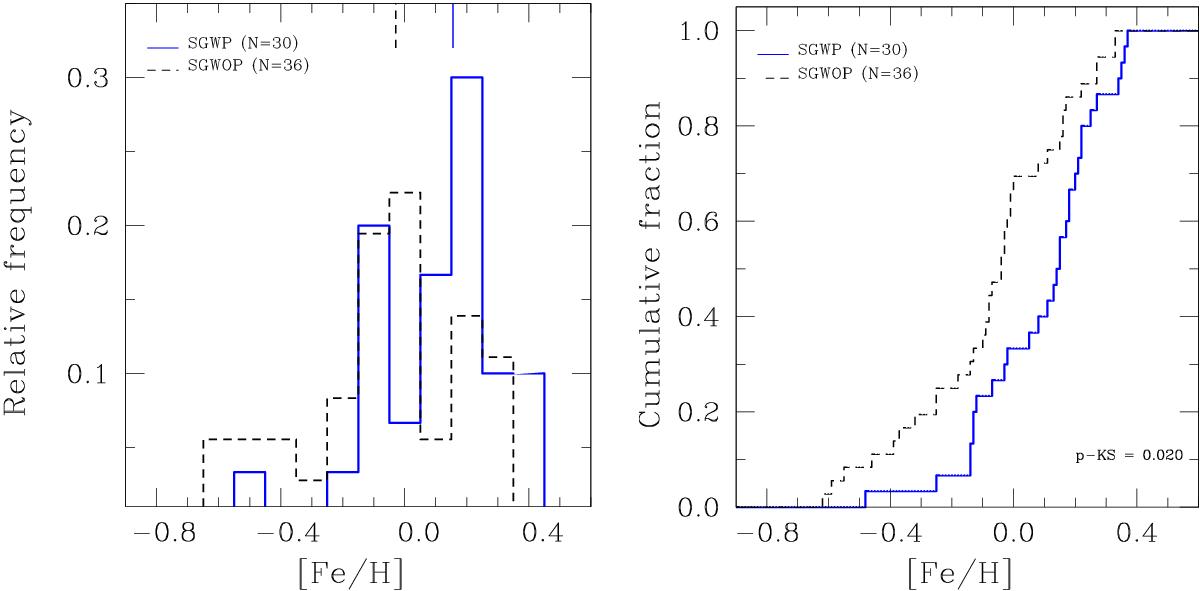
Normalized metallicity distribution (left panel) and histogram of cumulative frequencies (right panel) for the SGWP sample (blue continuous line) in comparison with the SGWOP sample (black dashed line). Median values of the distributions are indicated with vertical lines. The Kolmogorov-Smirnov test shows that the probability that these samples derive from the same population is ~0.02.
Current usage metrics show cumulative count of Article Views (full-text article views including HTML views, PDF and ePub downloads, according to the available data) and Abstracts Views on Vision4Press platform.
Data correspond to usage on the plateform after 2015. The current usage metrics is available 48-96 hours after online publication and is updated daily on week days.
Initial download of the metrics may take a while.