Fig. 11
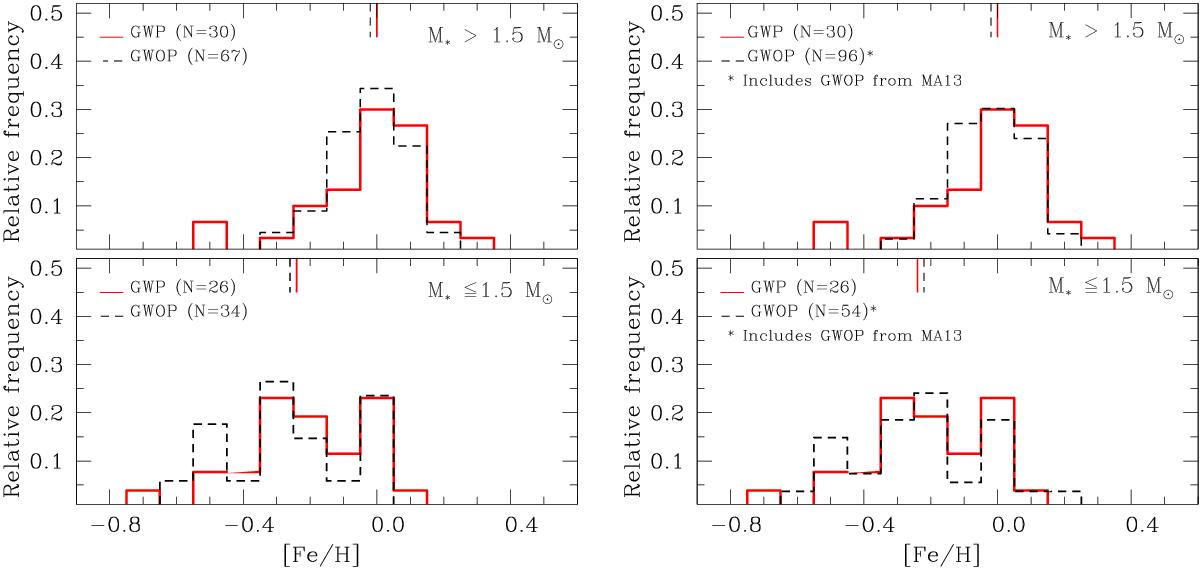
Left panels: normalized metallicity distribution for the giant stars with M⋆ > 1.5 M⊙ (top panel) and M⋆< 1.5 M⊙ (bottom panel). Right panels: same histograms as in the left panels but including the giant control sample from Maldonado et al. (2013). In all cases, the red solid line corresponds to the sample of giant stars with planets, whereas the black dashed line represents the giant control sample without planets. Median values of the distributions are indicated with vertical lines.
Current usage metrics show cumulative count of Article Views (full-text article views including HTML views, PDF and ePub downloads, according to the available data) and Abstracts Views on Vision4Press platform.
Data correspond to usage on the plateform after 2015. The current usage metrics is available 48-96 hours after online publication and is updated daily on week days.
Initial download of the metrics may take a while.