Fig. 1
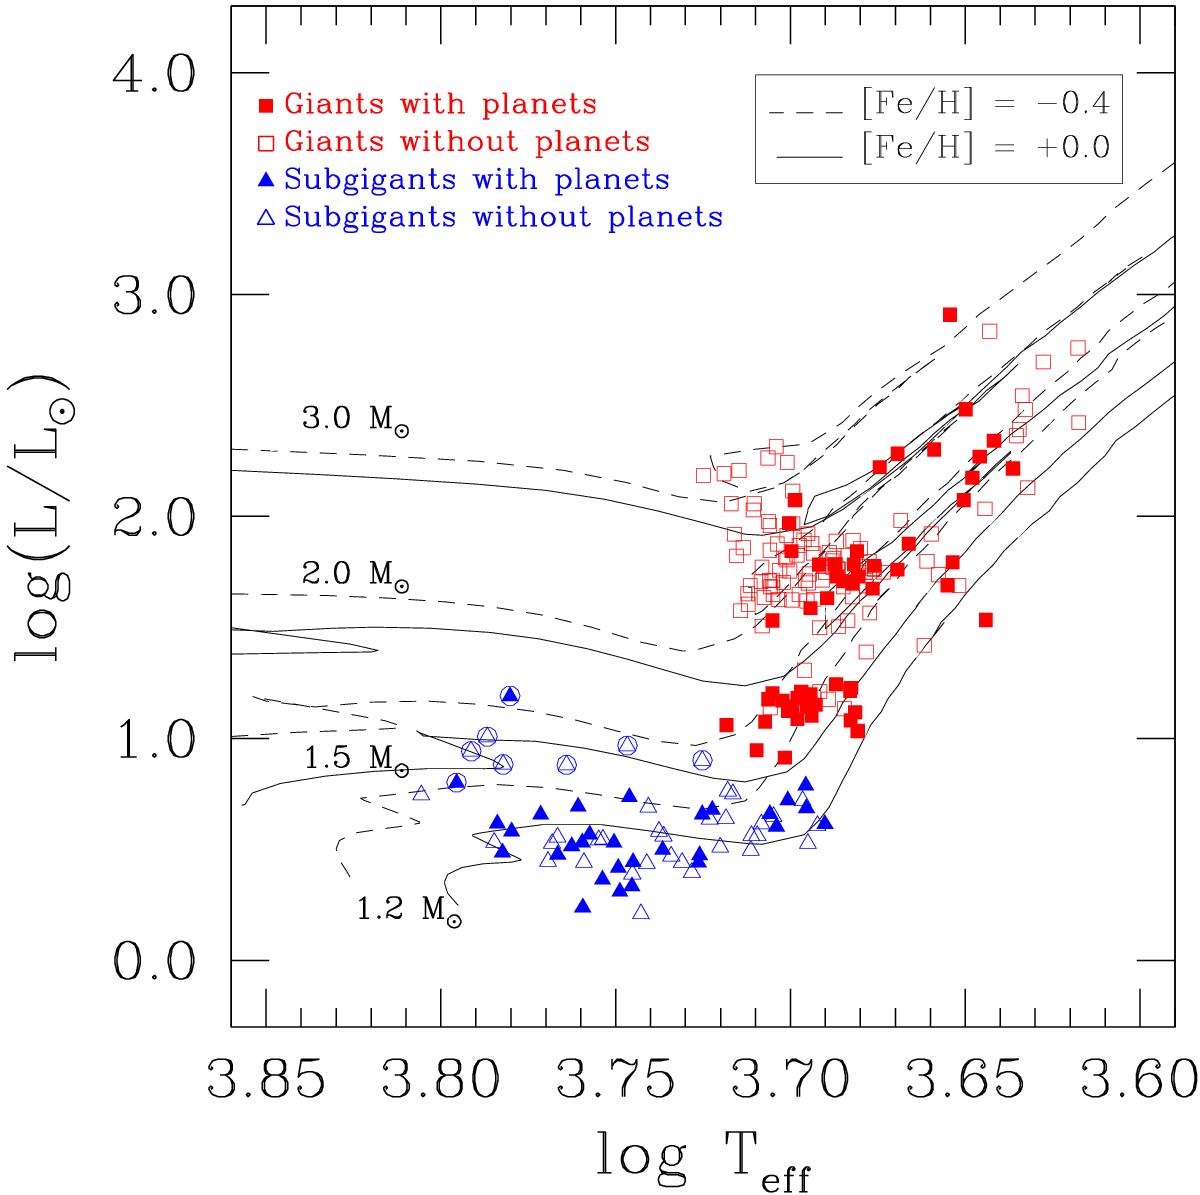
Location of the 223 evolved stars in an H-R diagram. Giant stars are indicated with squares and subgiants with triangles. Filled symbols correspond to stars with planets and empty symbols depict stars without planets. Evolutionary tracks for masses between 1.2 and 3 M⊙ from Girardi et al. (2000) are overplotted. Tracks for [ Fe/H ] = −0.4 dex are marked with dashed lines and those corresponding to [ Fe/H ] = + 0.0 dex are indicated with solid lines.
Current usage metrics show cumulative count of Article Views (full-text article views including HTML views, PDF and ePub downloads, according to the available data) and Abstracts Views on Vision4Press platform.
Data correspond to usage on the plateform after 2015. The current usage metrics is available 48-96 hours after online publication and is updated daily on week days.
Initial download of the metrics may take a while.